Chinese Markets Plunge as Investors React to Xi’s Re-election
25 October 2022, 07:05

| What You Need to Know |
Asian markets gained following the U.S. market footstep but the Chinese market plunged to reflect the concern over China’s political issues after President Xi’s re-election. The HSI dropped to near its worst since the 2008 global financial crisis and the yuan dropped to a 14-years low. On the other hand, the U.S. Fed will raise its rates by 75 bps for its fourth consecutive round and economists expect the Fed will not pause until the inflation rate is halved from the current level.
| Look Out For |
Current rate hike bets on 2nd November Fed interest rate decision:
75 bps (96.8%) VS 50 bps (3.2%)
| Market Overview |

| Economic Calendar |
|---|

Market Movements

XAU/USD
Gold prices edged higher on Tuesday, supported by a pullback in the dollar as investors awaited further signals on the U.S. Federal Reserve’s interest rate-hike decision.
From a technical view, MACD has reached the zero line and traders might keep an eye on it and wait for the breakout. Moreover, RSI is still hovering in the middle line of 50, which indicates the unavailability of a potential trigger for a decisive move.
Resistance level: 1677, 1733
Support level: 1615
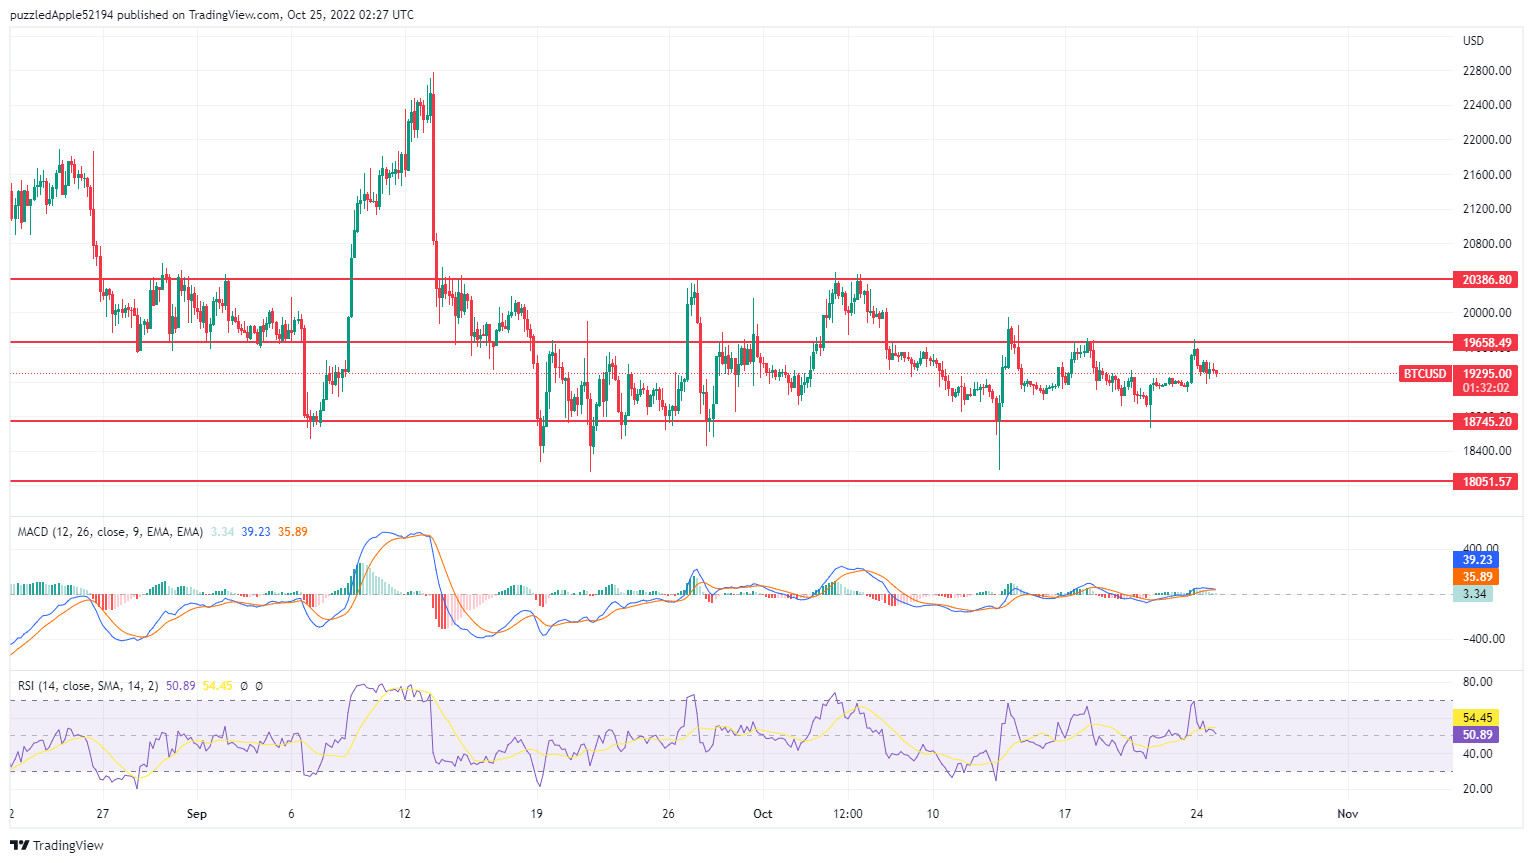
BTC/USD
BTC retracted from the resistance level due to profit-taking from investors. Nonetheless, Bitcoin is trading within a range between the psychological level of 19660 and 18745 as the market lacks a catalyst in the cryptocurrencies market.
On the technical front, MACD, which illustrated diminishing bullish momentum, suggests that the BTC would likely extend its losses on a short-term basis. Besides, the RSI indicator is at 52, suggesting that the pair’s outlook is bearish in the near-term as the RSI retraced sharply from the overbought level.
Resistance level: 19660, 20387
Support level: 18745, 18050

EUR/USD
The USD retreated after a few weak economic data were published. The market expects the European Central Bank (ECB) to raise its interest rate by 75 bps, which will be decided on Thursday. These might be bullish factors for the euro to trade above its trend line.
The EUR/USD pair was hovering near the upper trend line on the technical front. The euro is building momentum to test the resistant point at 1.000. The MACD is still above the zero line and the MACD line has crossed the signal line as well. RSI also picks up toward 70 and stays near to 64 as of writing.
Resistance level: 0.9970, 1.0100
Support level: 0.9720, 0.9570
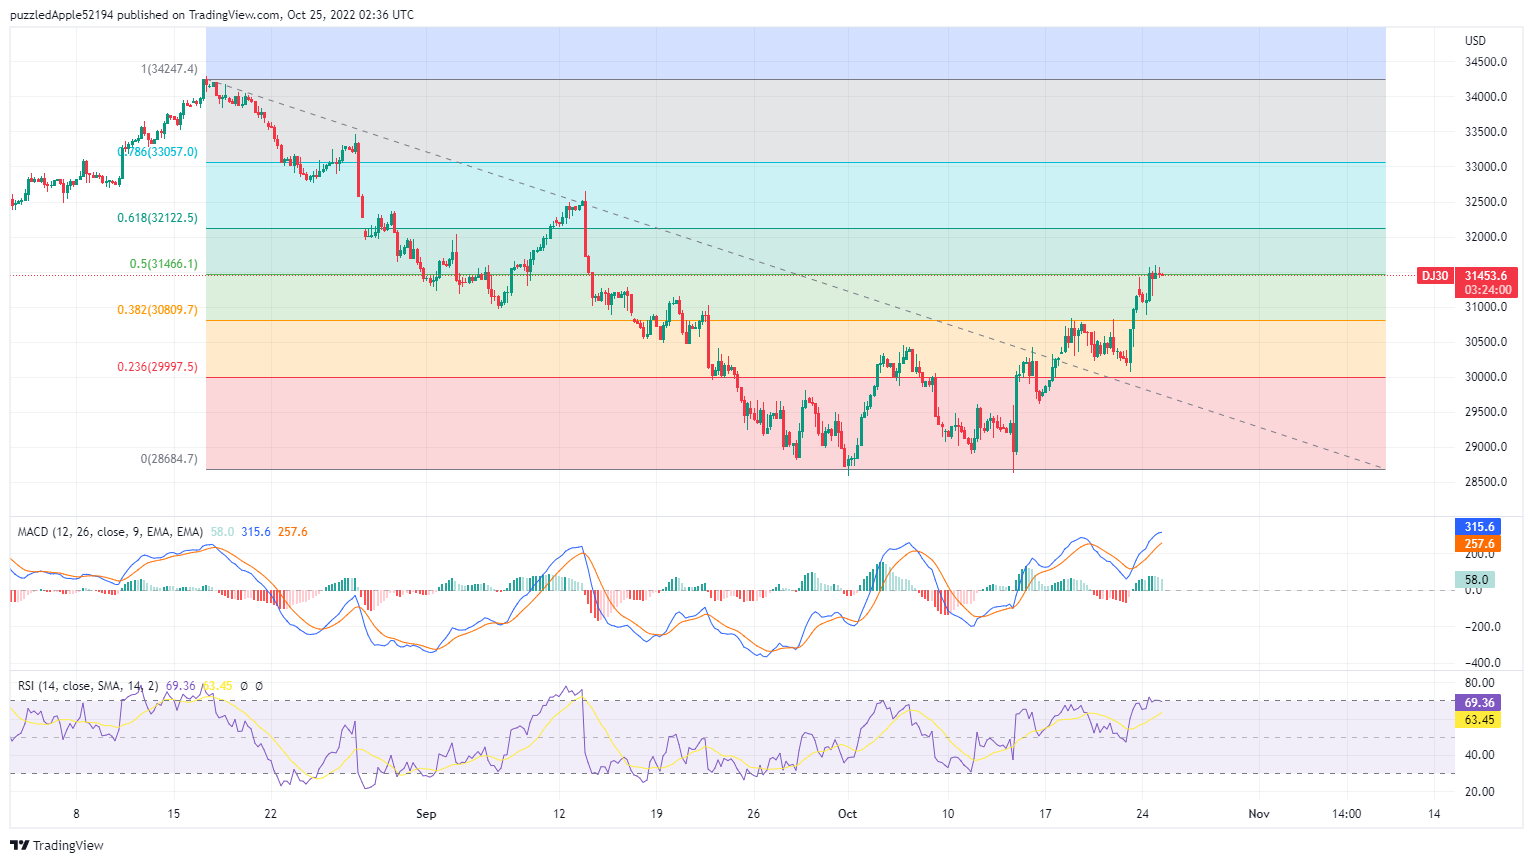
DJ30
The Dow surged into positive territory in the final minutes of trading, extending its bullish momentum as the recent downbeat economic data from the United States diminished the odds for the aggressive rate hike from the Federal Reserve. The data published by S&P Global yesterday showed that the US Composite PMI Output Index, which tracks the manufacturing and service sector, dropped to 47.3 this month from the preliminary reading of 49.5 in September.
From a technical view, the DJ30 extended its gains while currently testing the Fibonacci (50%) level at 31465. Nevertheless, MACD and RSI had indicated that the DJ30 is currently at an overbought level, suggesting the index to be traded lower in the short-term as a technical correction.
Resistance level: 31465, 32125
Support level: 30810, 29995
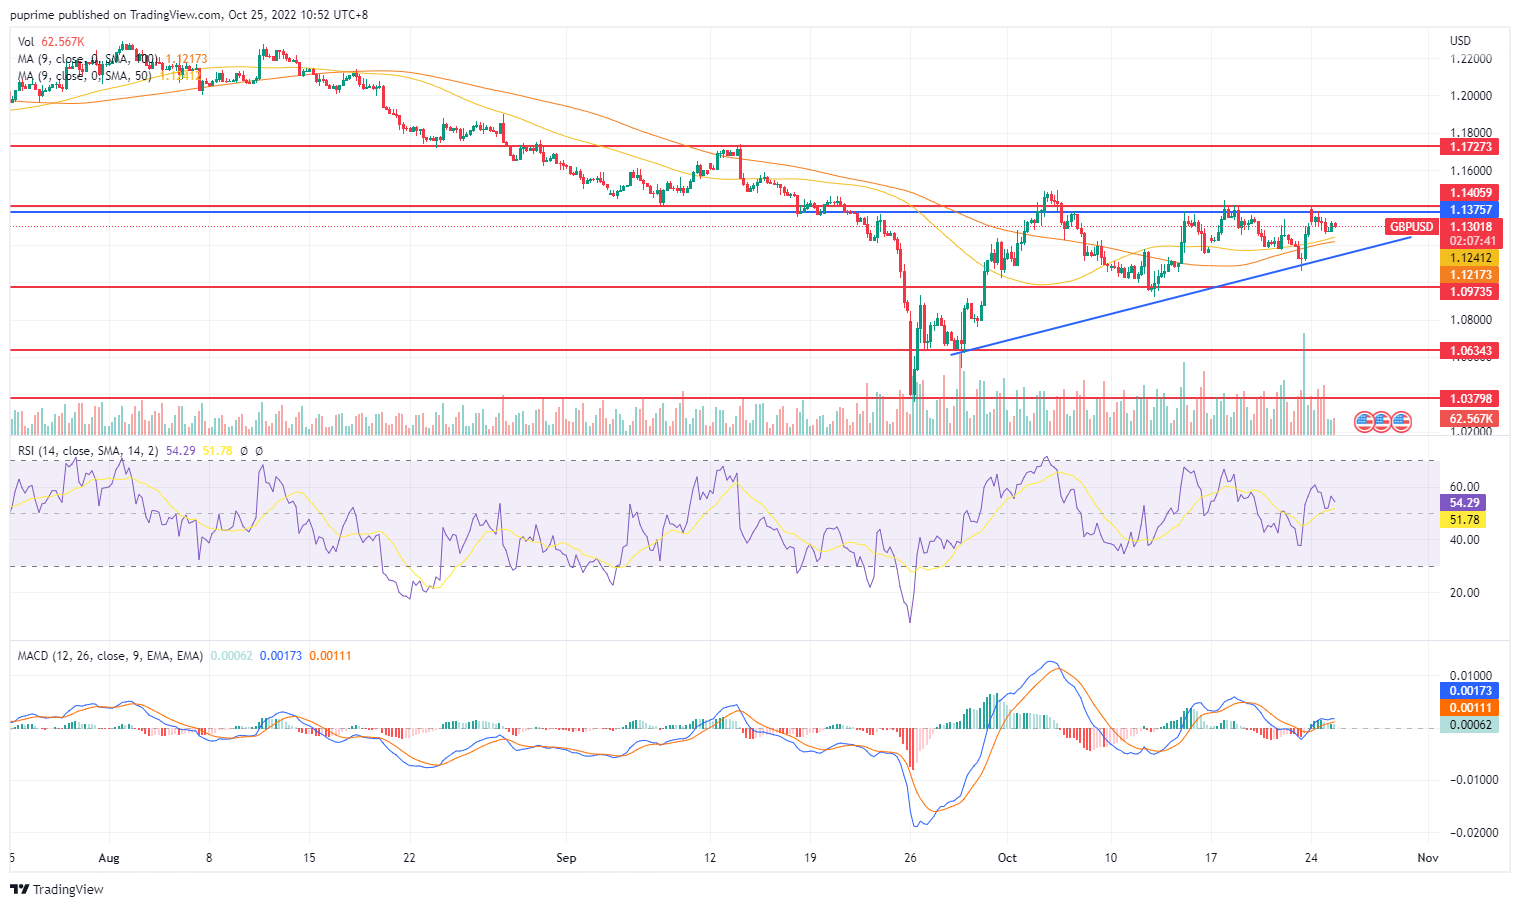
GBP/USD
The pounds gained as Sunak’s victory looks to lead the conservative party. At the same time, the pound is aiming at the month’s highs after Sunak was set to become Britain’s next prime minister, seeking to stabilise a country from the political and economic turmoil.
From the 4 hour chart, the blue line indicates the pair could be forming an Ascending Triangle chart. The pound is almost running out of room to consolidate between the resistance and the upward-sloping floor. The direction of the pound’s breakout from the triangle could be a key for determining the coming trend.
Resistance: 1.1406,1.1727
Support: 1.0973,1.0634
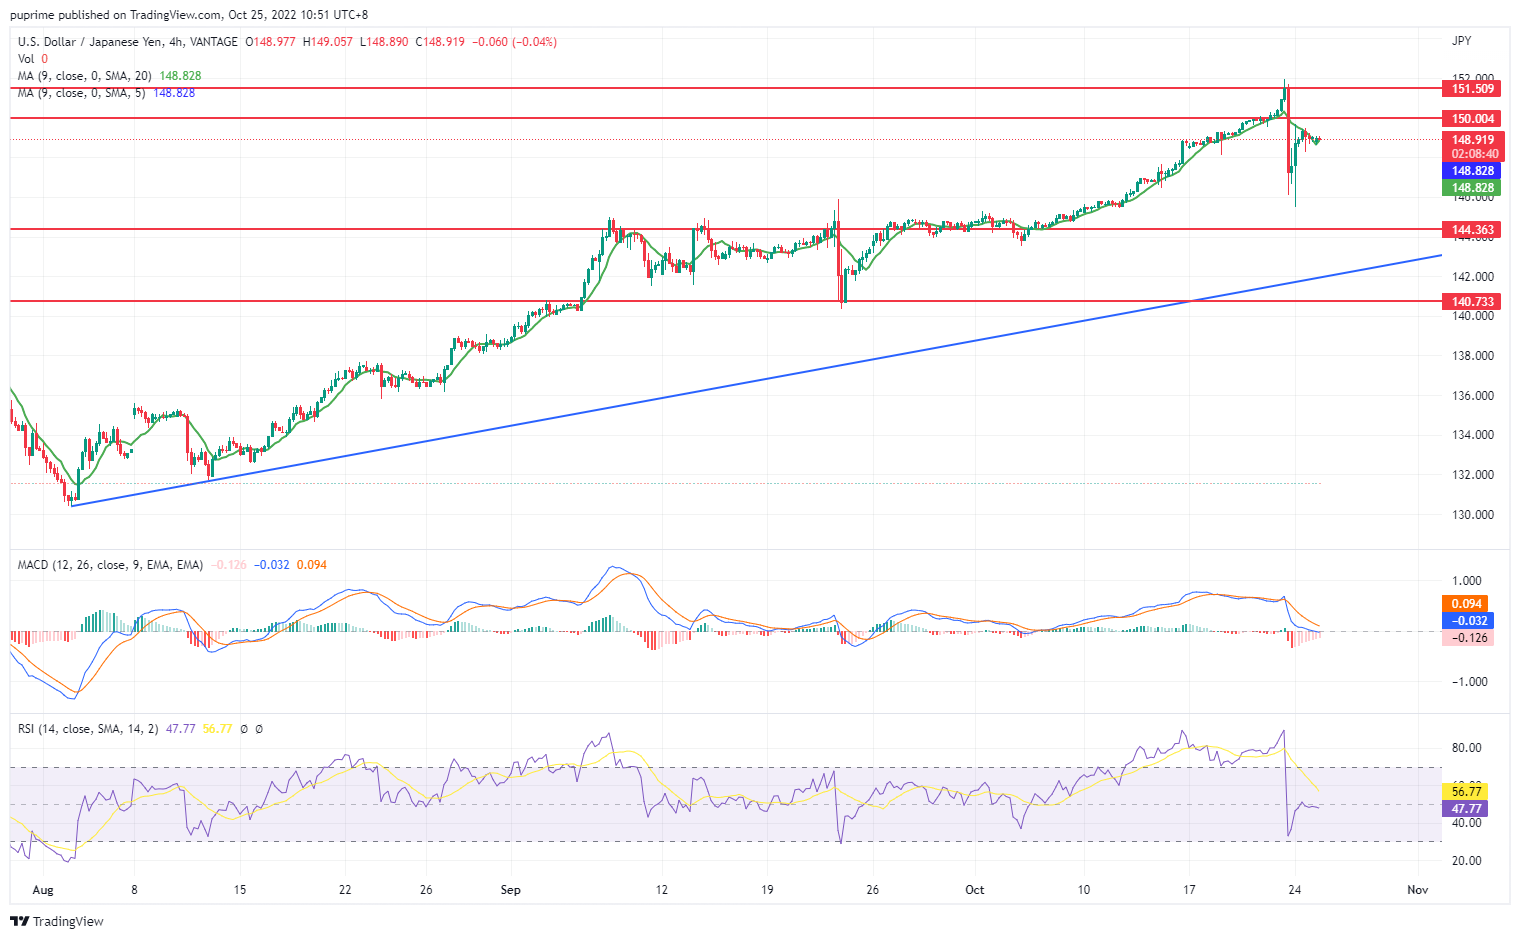
USD/JPY
The USD pulled back with unfavourable economic data, with the DXY staged below 112 at the time of writing. On top of that, the BoJ is expected to have more interventional activities to stabilise its over-speculated currency. The Yen has rebounded, hitting 145.48, but it did not last long as the dollar is still being supported. The pair seems to have a more volatile trend ahead.
On the technical side, the pair has broken through the 150-strong psychological resistance point, but sooner or later, an engulfing candle brought the pair to hit 146. The MACD line, on the other has crossed the signal line from above and falls below the zero line. While for the RSI has also fallen from above 70 and now is hovering near 50 as of writing.
Resistance level: 150.00, 151.54
Support level: 144.36, 140.73

Crude oil
The crude oil price extended its losses amid the global recession fears, and the weakening Chinese oil demand continues to spark further selloffs on this black commodity. Recently, higher interest rates and recession fears following the release of negative economic data from the European Union and United Kingdom regions continue to act as headwinds for the oil price.
On the technical front, the crude oil price is currently near the support level of 83.20. MACD, which illustrated diminishing bullish momentum, suggested the commodity extend its losses toward the support level. RSI is 47, suggesting the downside is more favoured as the RSI stays below the midline.
Resistance level: 93.55, 103.90
Support level: 84.30, 76.20

DXY
The Dollar Index edged lower yesterday over the backdrop of downbeat economic data, which clouded the outlook for the economic momentum in the United States. According to S&P Global, the US Composite PMI Output Index, which tracks the manufacturing and service sector, dropped to 47.3 this month from the preliminary reading of 49.5 in September. The downbeat economic data prompted the Federal Reserve to reassess how aggressive the rate hike would be to stabilise the spiking inflation risk without jeopardising economic growth.
On the technical front, the Dollar index was traded lower while currently testing the support level at 111.85. MACD illustrated an increasing bearish momentum suggesting the index extended its losses after breakout the support level. RSI is at 40, suggesting bearish momentum is favoured as the RSI stays below the midline.
Resistance level: 113.45, 114.80
Support level: 111.75, 110.15
Articles
Contact Us
For general customer related enquiries
+248 4671 948
[email protected]
For legal or regulatory related enquiries