Inverted Bond Yield-Curve Signals Recession
2 November 2022, 09:00

The short-term Treasury yield has surpass long-term bond yield, and it is a recession signal that cannot be ignored.
What You Need to Know
An inverted bond yield curve occurs when the 2-year treasury bond pays more than the 10-year treasury bond, implying a recession is around the corner. This has happened yet again this year, with the spread between the 2-year and 10-year notes is -47 basis points. It is predictable that the rates will continue to go up until the inflation rate is at least half its current amount. Oil prices rose with the surprise drop in the U.S. oil stockpile, suggesting strong demand for oil despite steep interest rate hikes. The Hang Seng index rallied nearly 6% in the previous session due to unverified information that China is to reopen its economy from Covid restrictions – a rally that may not last long. China’s spokesman has spoken out to clear the rumour and said he is unaware of such news.
| Look Out For |
Current rate hike bets on 2nd November Fed interest rate decision:
75 bps (86.5%) VS 50 bps (13.5%)
| Market Overview |

| Economic Calendar |
|---|

Market Movements

DXY
The Dollar Index edged higher yesterday over the backdrop of upbeat economic data from the United States, which insinuated hopes of a more aggressive rate hike decision from the Federal Reserve. According to the Institute for Supply Management, the US ISM Manufacturing Purchasing Managers Index (PMI) recorded 50.2, exceeding the market forecast of 50.0. Meanwhile, US JOLTs Job Openings came in at 10.717M, which also fared better than market expectation at 10.000M. Both upbeat economic data indicate that the US economy stayed resilient, dialling up the market’s optimism toward economic progression in the United States.
The Dollar Index is trading higher following the prior rebound from the previous support level of 109.95. Nevertheless, MACD illustrated diminishing bullish momentum while the RSI is at 50, indicating the Dollar Index to continue to trade within a side-way in the short term.
Resistance level: 111.75, 113.45
Support level: 109.95, 107.55

XAU/USD
Gold prices remain sideways around $1649, unable to break much fresh ground. Nonetheless, the gold market received bullish momentum ahead of the upcoming FOMC verdict. As for now, market participants remain concerned about the monetary policy decision from the Federal Reserve, which spurred risk-off sentiment in the global financial market while increasing the appeal for safe-haven gold.
MACD is hovering below zero, which indicates a bearish momentum. RSI is trading around 50-53, suggesting that both directions may happen as investors await the FOMC verdict on Wednesday.
Resistance level : 1677, 1733
Support level : 1615, 1569
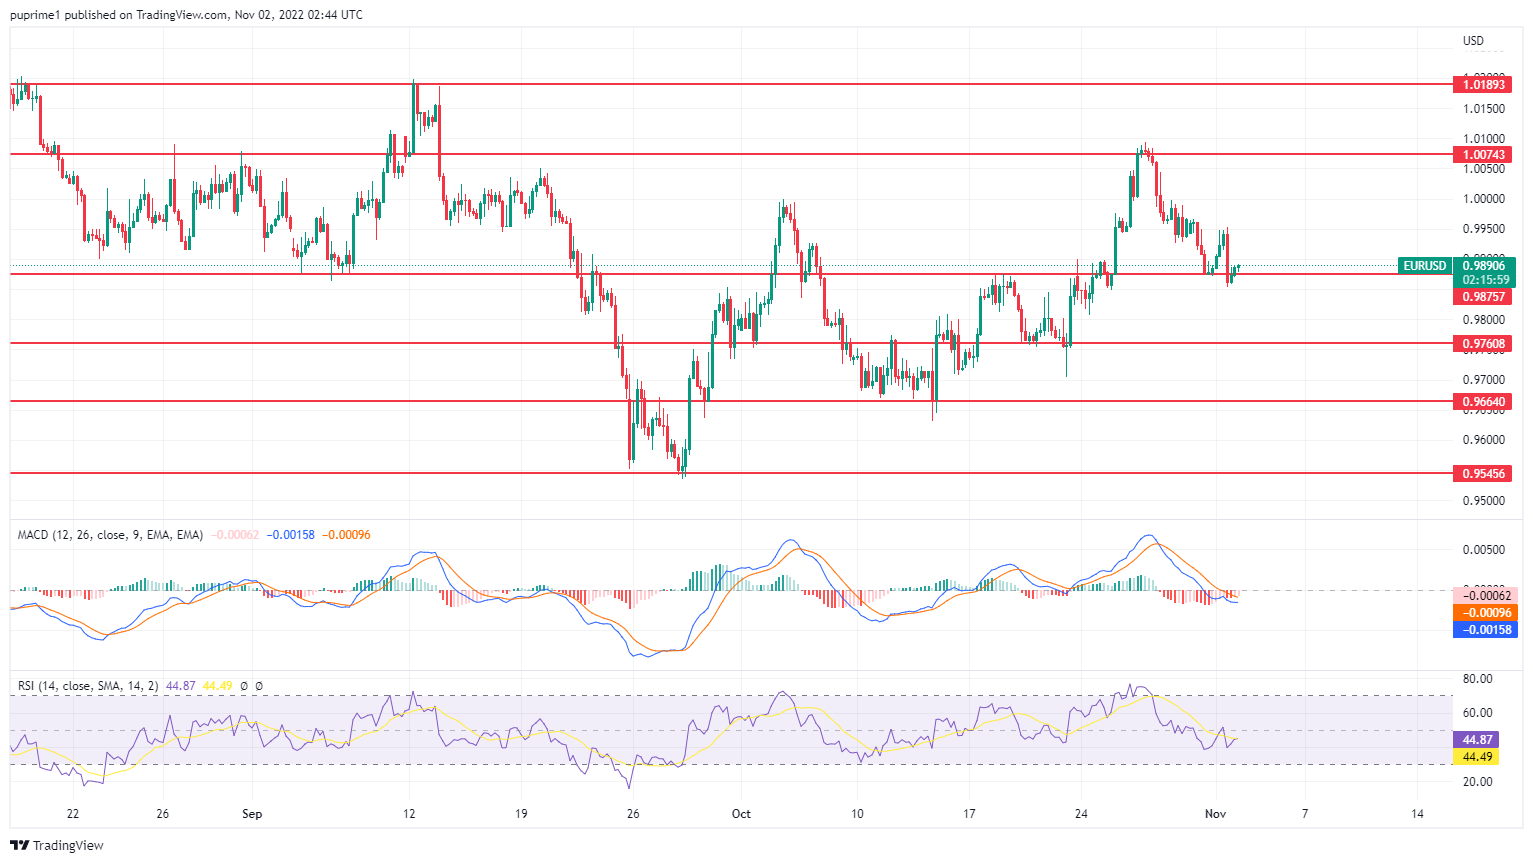
EUR/USD
The higher market demand for the US Dollar continues to weigh on the shared currency as market participants brace for another round of tightening decisions from the Federal Reserve. The pair of EUR/USD continues to stay in negative territory.
From the technical viewpoint, the pair of EUR/USD is trading lower while currently testing the support level at 0.9875. Nevertheless, MACD illustrated a weakening bearish momentum. At the same time, the RSI at 45 has sharply rebounded from the oversold territory, suggesting the pair is trading higher in the short term due to a technical correction.
Resistance level: 1.0075, 1.0190
Support level: 0.9875, 0.9760

BTC/USD
BTC has been trading flat after breaking its resistance line at 20400 and was consolidating in the past week. While the market is awaiting the rate hike announcement on 2nd November, it is almost certain that the Fed will raise 75 bps for the 4th straight time. A stronger dollar could lead the cryptocurrency market to see a new low.
The trading volume has been very low for the past week as the market is still determining the direction of the coin. The MACD line and the signal line are moving toward the zero line, and the histograms show that the gap between the 2 lines is getting closer. On the other hand, the RSI has just reached 50 as of writing, which is no indication of price movement.
Resistance level: 21050, 22040
Support level: 20400, 18450
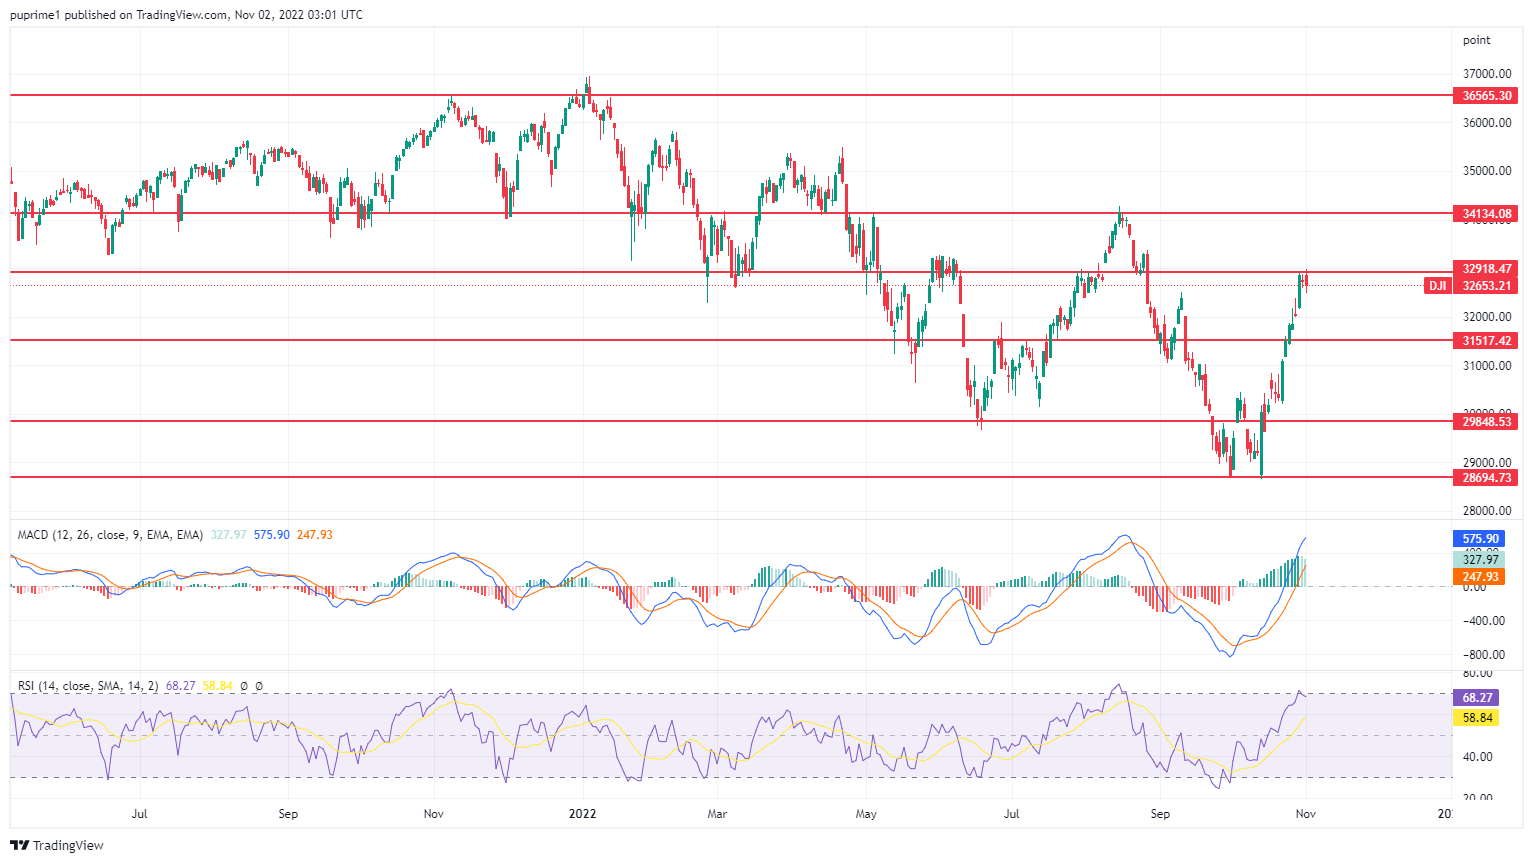
DJ30
The Dow Jones experienced a weak start in November as overwhelming economic data yesterday had spurred an oversized rate hike speculation. US Treasury yields rebounded from session lows following the manufacturing and job data indicating upbeat reading. As for now, market participants speculate that the Federal Open Market Committee (FOMC) will likely raise interest rates by 0.75% on Wednesday. Meanwhile, Investors will continue to scrutinise the monetary policy statement from the Federal Reserve for fresh clues about future rate decisions.
The DJ30 extends its gains while currently testing resistance levels. MACD illustrates diminishing bullish momentum while RSI is at 68, suggesting the stock index is now in overbought territory.
Resistance level: 32920, 34135
Support level: 31515, 29850
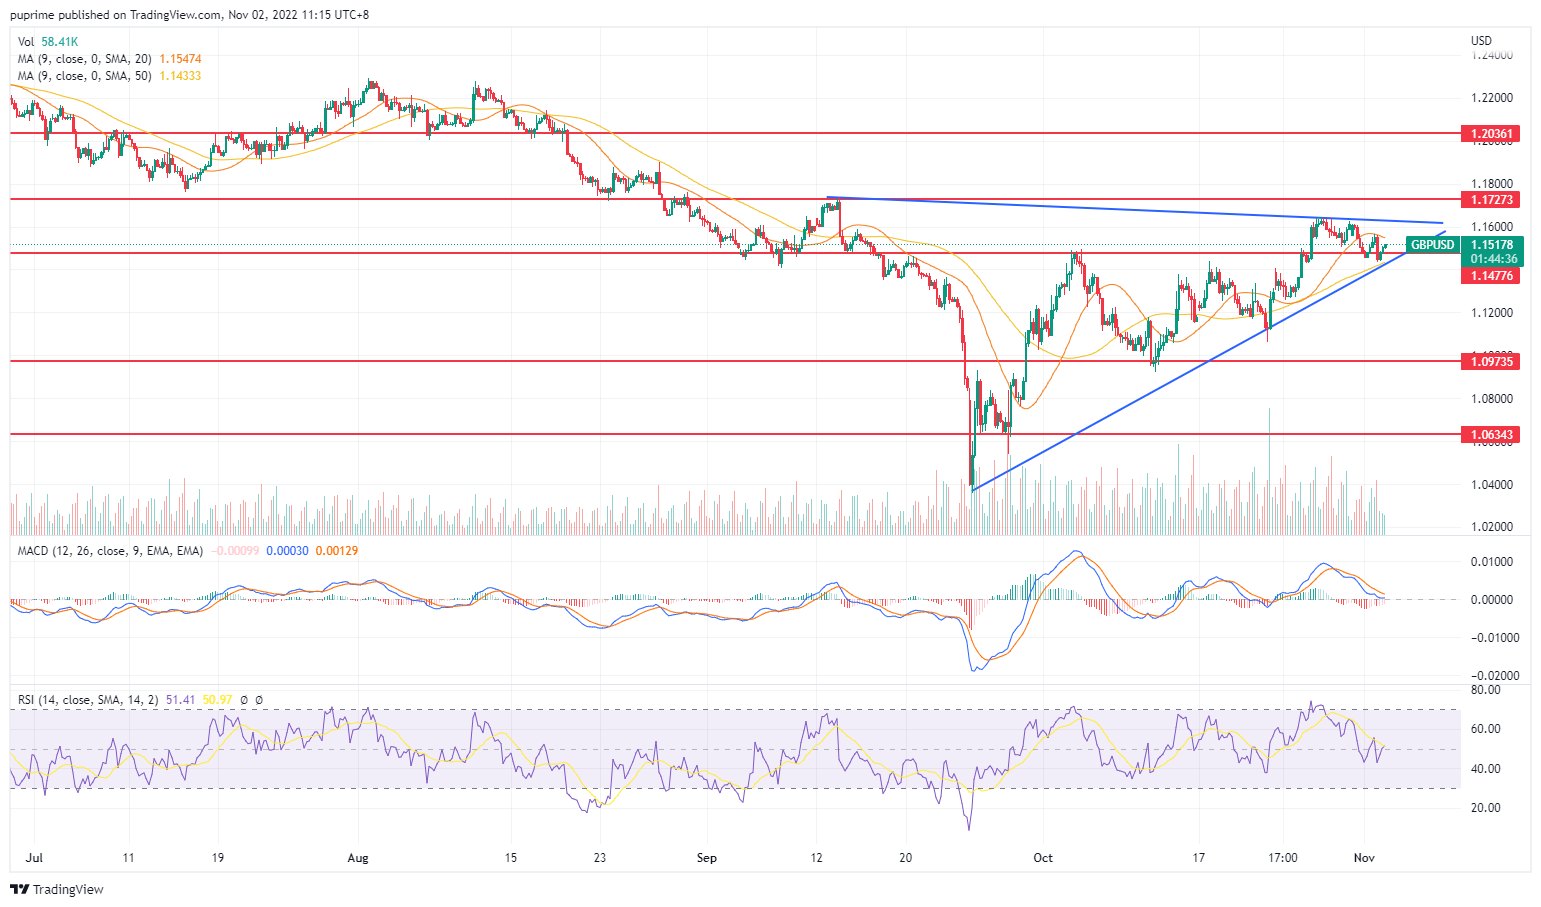
GBP/USD
The pound edges slightly higher against the dollar and is trading at 1.1520 at the time of writing. Moreover, markets are focusing more on the Federal Reserve’s interest rate announcement.
Therefore, investors can keep an eye on BoE rate hike action following the Fed’s announcement tonight.
The pair shows the continued development of the rising wedge formation (blue colour) as prices hover around the 1.15 psychological handle. While MACD is dropping back to the zero line, indicating a possible downward movement if it breaks through zero. At the same time, RSI also hovers around 50, suggesting the pair is struggling to find a decisive direction.
Resistance: 1.1727,1.2036
Support: 1.1477, 1.0973
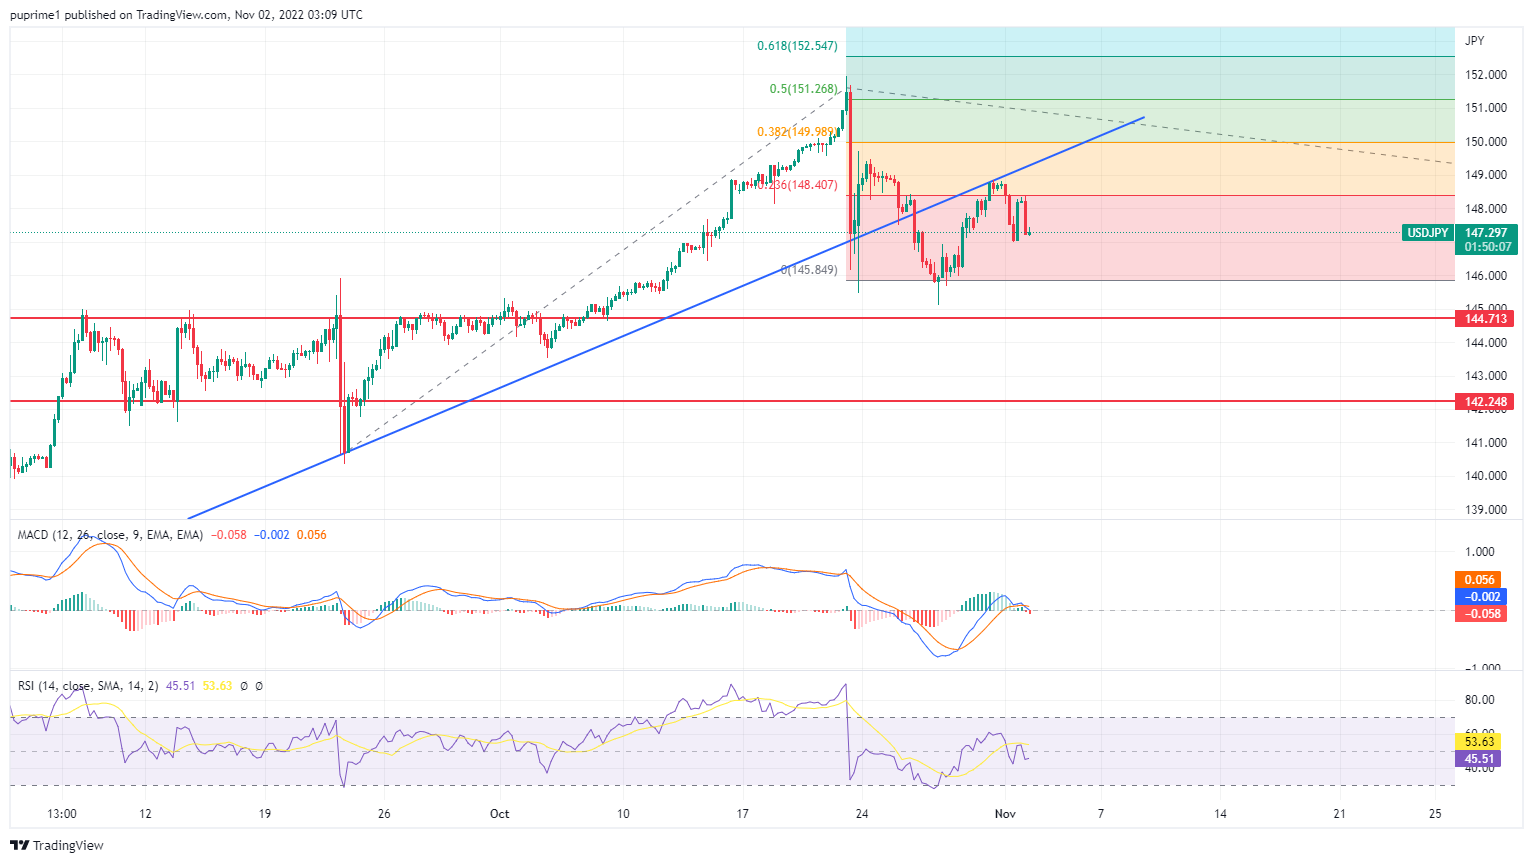
USD/JPY
The current expectation of currency interventions from the Bank of Japan (BoJ) continues to spur the bullish momentum of the Japanese Yen. According to Reuters, the Bank of Japan (BoJ) spent a record $42.8 billion on currency intervention for October to stabilise the Japanese Yen. Meanwhile, Japan’s top currency diplomat, Masato Kanda, reiterated that there was no limit to the authorities’ resources for implementing currency interventions.
USD/JPY is trading lower following the prior retracement from the resistance level. MACD has illustrated bearish bias, while RSI is at 45, below the midline, suggesting the pair will likely extend its losses toward the first support level.
Resistance level: 148.40, 150.00
Support level: 148.40, 145.85
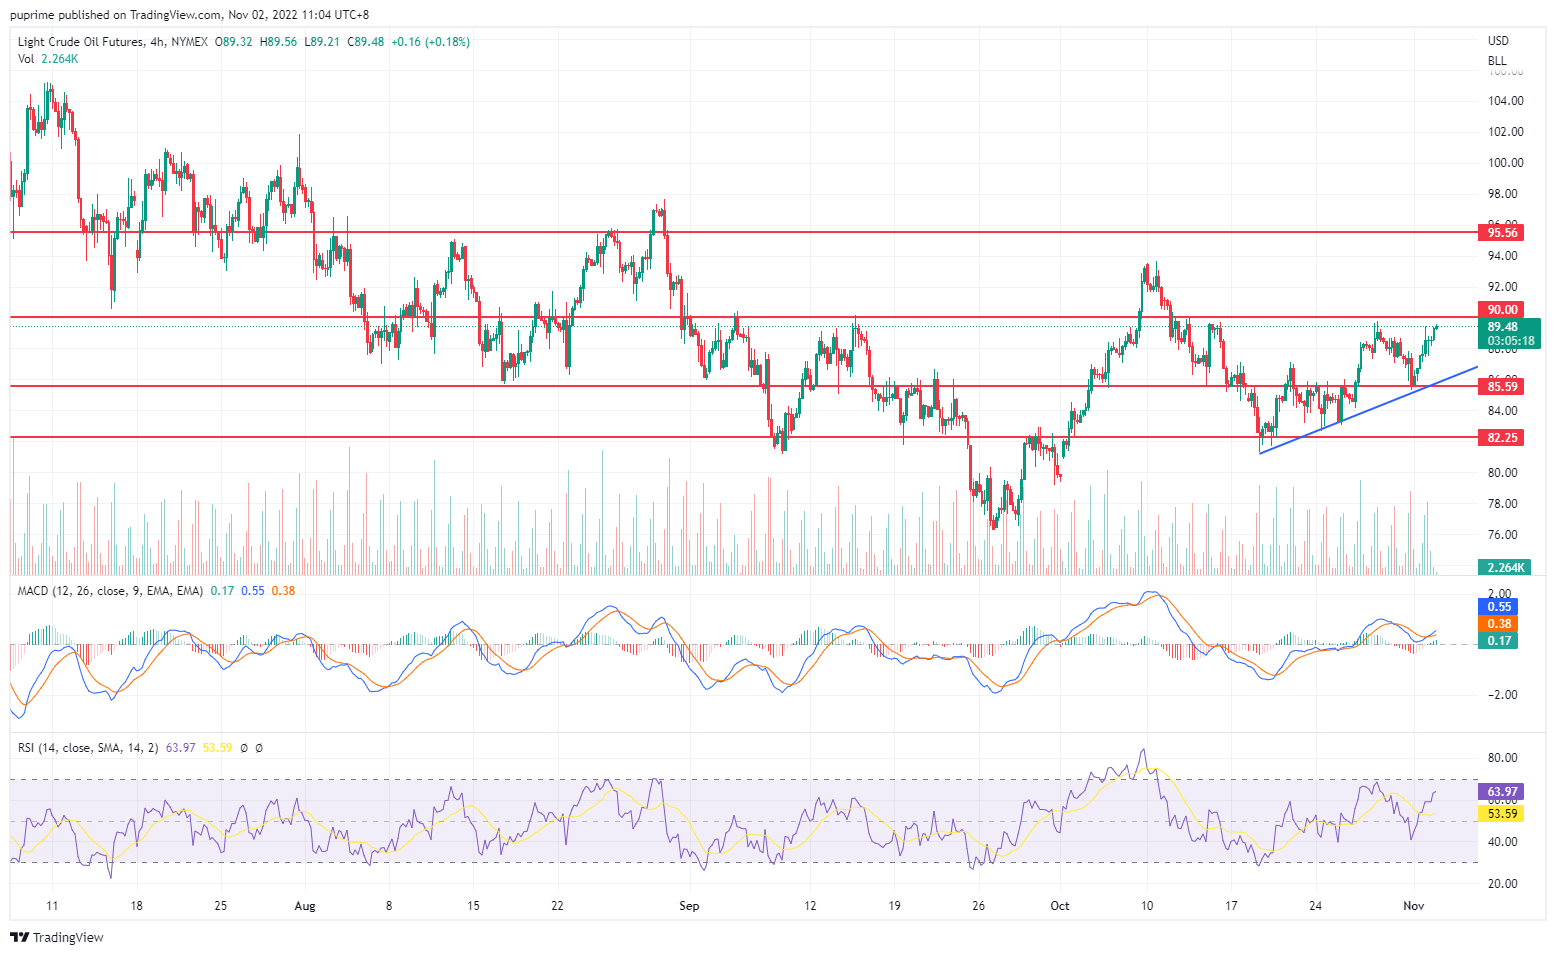
Crude oil
The OPEC+ oil cut and the U.S. robust oil export data will be fundamental for the oil price to surge higher. Economists believe that the dwindling oil supply and higher oil demand would push oil prices to $100 per barrel.
Oil prices recorded a monthly gain in October and is now rallying to reach its psychological resistance point at $90. The MACD has just crossed against the signal line, and the gap is starting to widen and depicts a bullish signal. On the other hand, the RSI is moving upward in November from 40 to 64 as of writing, suggesting a bullish bias for oil.
Resistance level: 90, 95.5
Support level: 85.6, 82.2
Articles
Contact Us
For general customer related enquiries
+248 4671 948
[email protected]
For legal or regulatory related enquiries