UK’s Liz Truss Steps Down From PM Position
20 October 2022, 08:27

| What You Need to Know |
Liz Truss resigned from the PM office led to the pound dipping by 0.21% after the market digested the country’s political uncertainty. The euro also fell 0.15% last night following the move in sterling. Meanwhile, Japan’s CPI has recorded an 8-year high of 3% in September, pushed by expensive import costs, while the Yen slumped to 32-year lows.
| Look Out For |
Current rate hike bets on 2nd November Fed interest rate decision:
75 bps (93.1%) VS 50 bps (6.9%)
| Market Overview |

| Economic Calendar |
|---|

Market Movements

XAU/USD
Gold prices dropped as the US Federal Reserve continued to tighten monetary policy. Yesterday, both US Initial Jobless Claims and US Existing Home Sales both fared much better-than-expectation, spurring the greater expectation of a higher rate hike from the Federal Reserve. The strong dollar contributed to the pair’s decline towards the support level of $1622, its lowest level in three weeks.
On the technical front, investors would remain focused on the crucial support level at 1615. Due to the recent appreciation of the US Dollar, the overall trend for gold is likely to extend its losses following its breakout below the support level.
Resistance level: 1677, 1733
Support level: 1615

BTC/USD
BTC continues to trade in a sideways pattern in a range between 20400 to 18460 where there are no notable developments in the market for the cryptocurrency to pick a direction.
On the technical front, investors should highly focus on the support level at 18460. The MACD has been hovering around the zero line, and it is the same with the RSI ranging near 50, with both depicting that there is a lack of direction for the btc.
Resistance level: 20400, 21760
Support level: 18460

EUR/USD
The overall bearish trend for the pair of EUR/USD was mostly due to the appreciation of the US Dollar. Recently, the US Dollar extended its gains yesterday on the backdrop of upbeat economic data from the US region. According to the Department of Labor, US Initial Jobless Claims came in at only 214K, which fared better-than-market expectation of 230K.
On the technical front, the pair of EUR/USD was hovering near the resistance level at 0.9850. On the bullish front, MACD had illustrated diminishing bearish momentum, suggesting the pair would likely extend its gains after it successfully breakout the resistance level. Nonetheless, If the pair of EUR/USD fails to breakout above, then the pair would dip toward the support level at 0.9675.
Resistance level : 0.9850, 1.0000
Support level: 0.9675, 0.9540
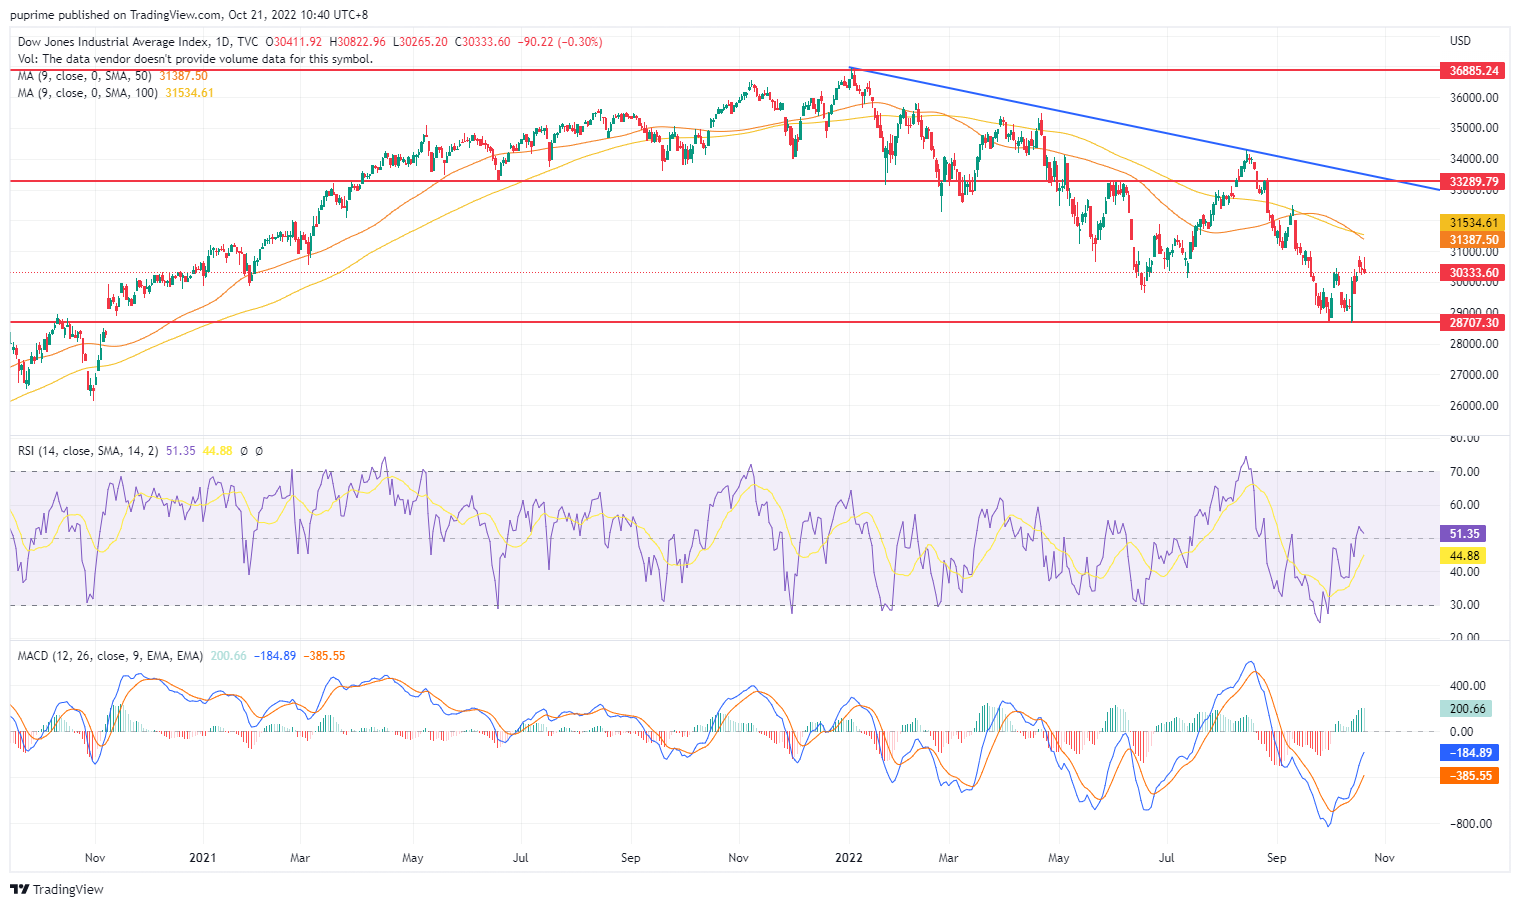
DJ30
DJI fell by 0.3%, starting to give back their weekly gains as treasury yield rose yesterday. The benchmark 10-year Treasury bond yield rose to its highest level since June 2008, following the release of upbeat data from the labour and housing sector, which reinforced the expectation for the rate hike decision from the Federal Reserve. In addition, the political uncertainty from the UK region had also sparked risk-off sentiment in the global financial market, which prompted investors to sell off further for the US stock index.
On the technical front, the DJI30 rebounded from the strong support level at 28707. MACD, which illustrated increasing bullish momentum, suggested the index extend its gains toward the resistance level at 31637.
Resistance level: 31637, 33289
Support level: 28707
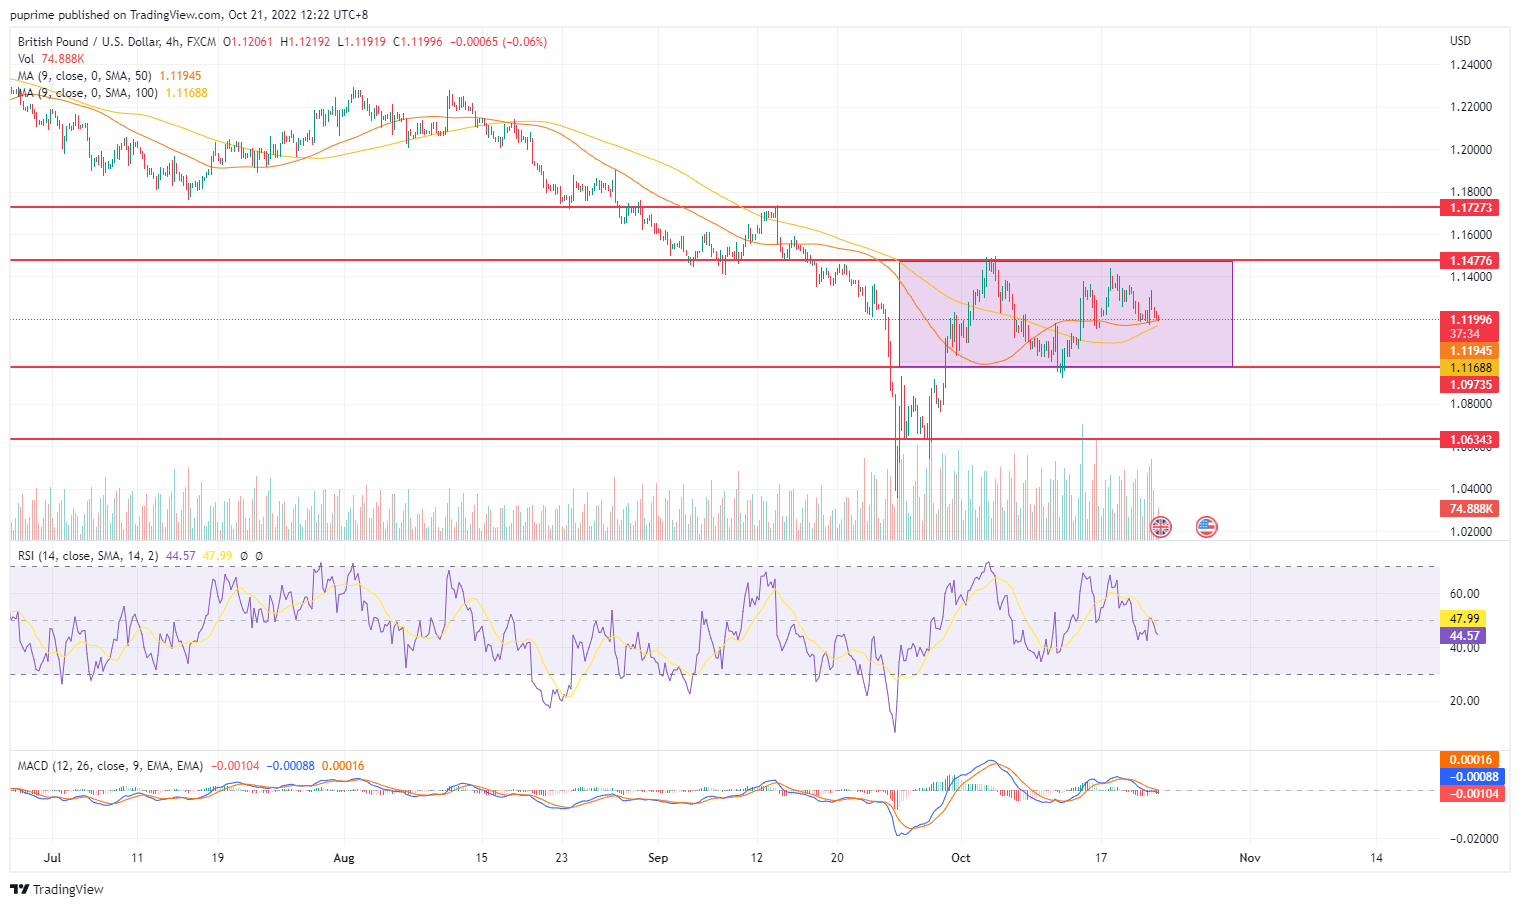
GBP/USD
The Pound Sterling, which is majorly traded in the global financial market, retraced from the crucial resistance level at 1.1480 amid political uncertainty continuing to spark further selloff on Pound Sterling. Yesterday, UK Prime Minister Liz Truss made a resignation announcement as prime minister, the shortest-serving Prime Minister in UK’s history. The leadership election will be announced within the next week to replace Liz Truss, as for now, investors will continue to focus on the UK’s political development to receive a trading signal.
On the technical front, the pair of GBP/USD is currently forming a head and shoulder signal. At the same time, the MACD, which illustrated bearish momentum, suggested the pair is likely to extend its losses toward the first support level at 1.0975..
Resistance level: 1.1480, 1.1725
Support level: 1.0975, 1.0635
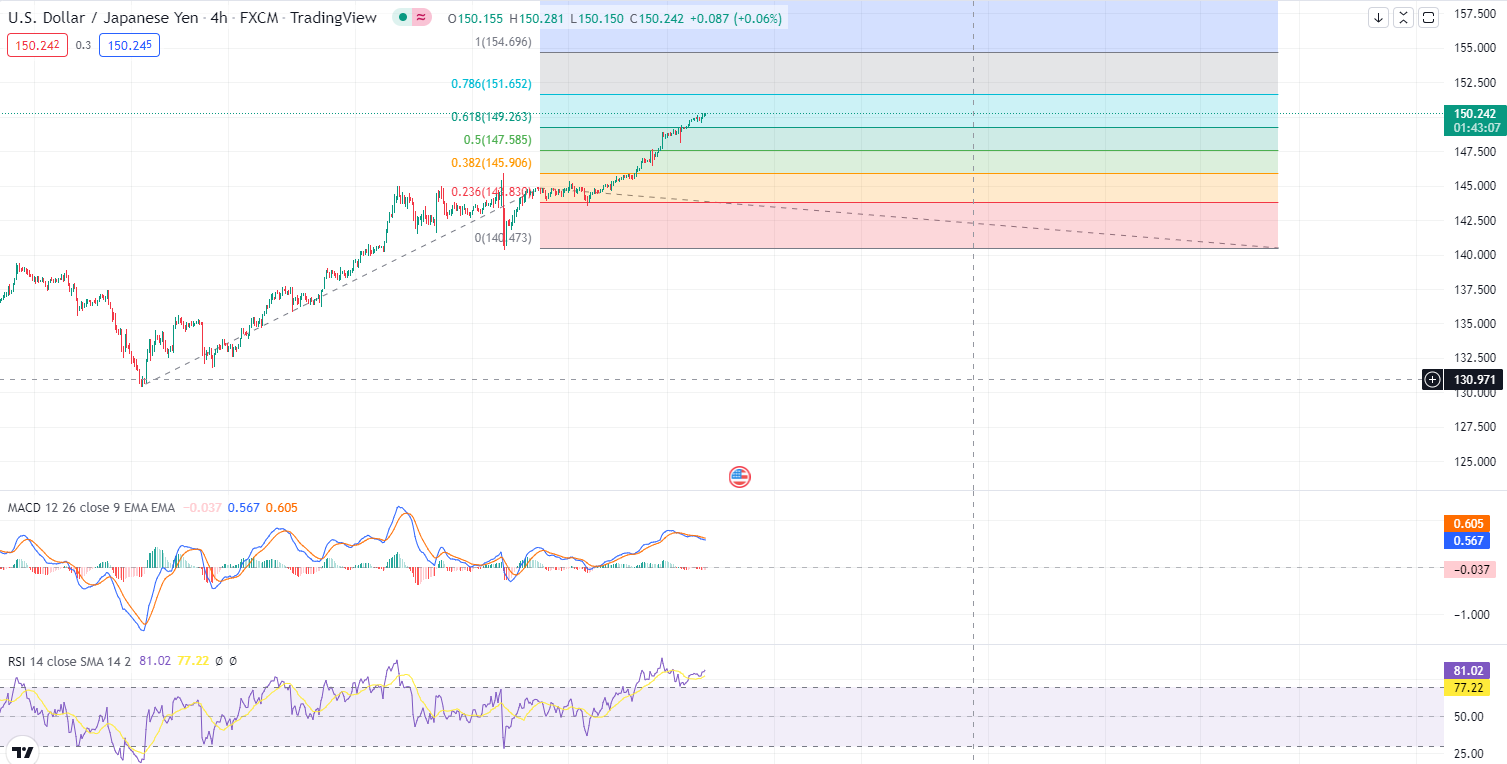
USD/JPY
The recent aggressive rate hike expectation from the Federal Reserve had widened the government Treasury yield gap between the United States and Japan, which sent the pair of USD/JPY into the symbolic level for the first time since 1990 on Thursday despite the Bank of Japan (BoJ) intervention still on the table. Japan’s contradictory stance with the global central bank had left the yen at risk of further slide.
On the technical front, the pair of USD/JPY successfully breakout above the previous resistance level from Fibonacci expansion at 149.25. With the combination of the recent strength from the US Dollar, we could expect the pair of USD/JPY would extend its gains toward the resistance level (149.25). Though, we suggested that investors pay great attention to the intervention policy from the Bank of Japan (BoJ) to gauge the likelihood of movement for the currency.
Resistance level: 151.65, 164.70
Support level: 149.25, 147.60
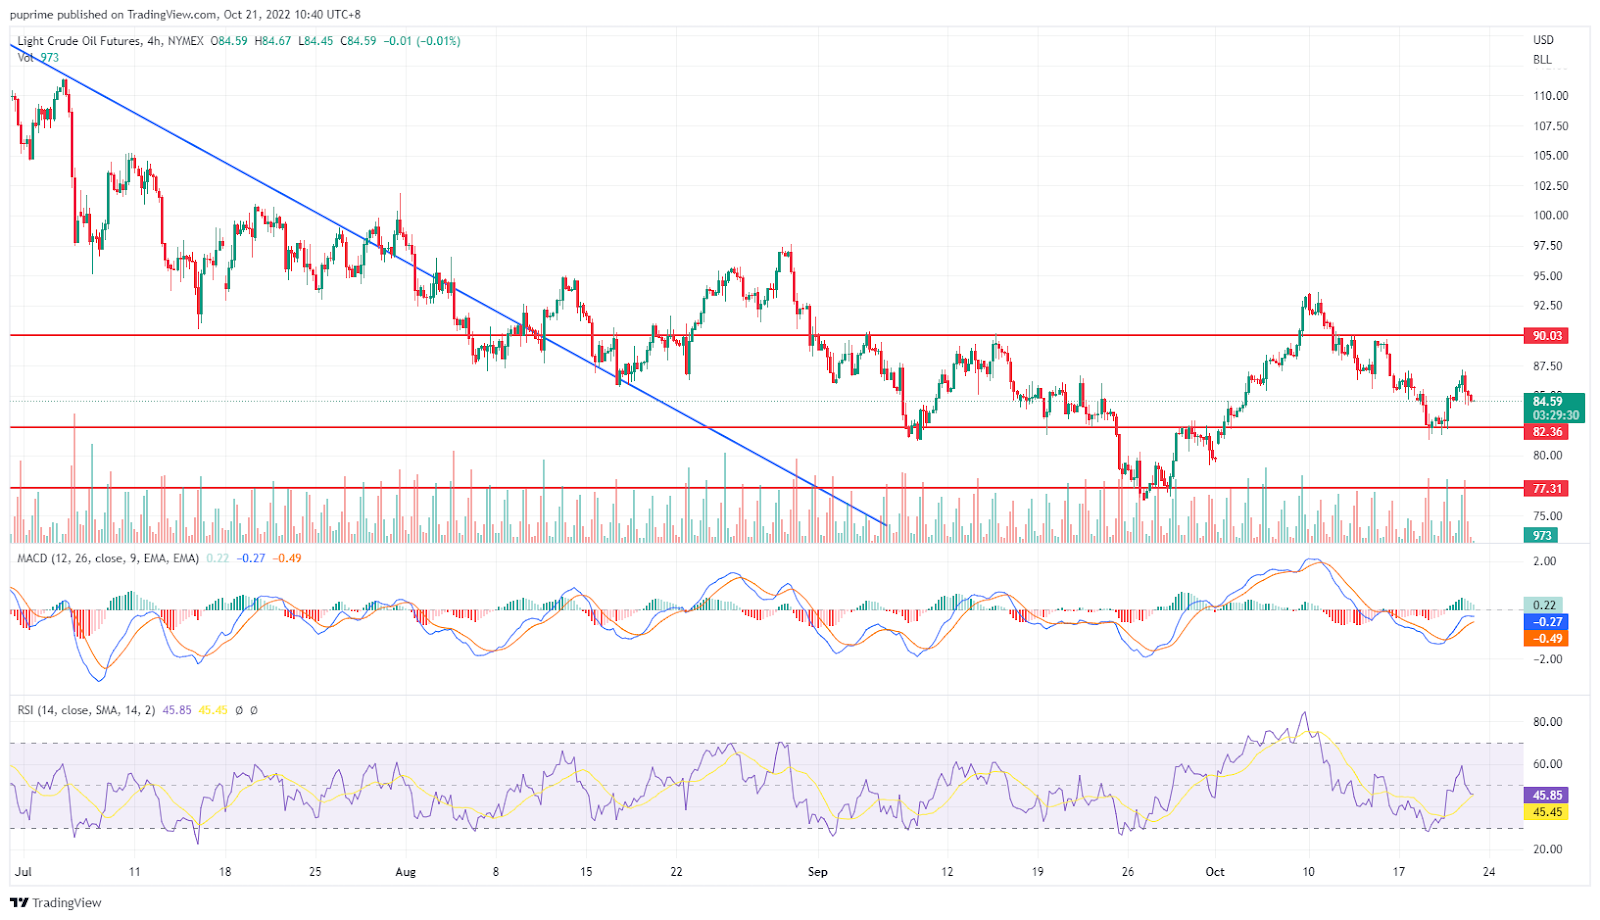
Crude oil
The oil price was trading in a flat with a downward bias last night in concern over the inflation that could potentially dampen oil demand. China is considering easing its pandemic quarantine measure that suggests an increase in economic activity and the EU sanction on Russian crude and oil products might lead to a price hike in oil price; however, Biden’s administration would try to keep the oil price below 80 to curb its already high inflation.
On the technical front, the overall trend for crude oil remained bearish while currently testing on the crucial support level at 82.35. MACD, which illustrated diminishing bullish momentum, suggested the commodity to extend its losses toward the support level at 82.35.
Resistance level: 90.00
Support level: 82.35, 77.3

ETH/USD
Ethereum maintained its sideways momentum and gained a little by 0.58% at the press time. Fidelity, an enormous asset management firm, announced that ETH would soon be offered on its platform starting next week; this will lead to more trading activity on ETH and might fluctuate the price of the ETH.
On the technical front, the overall trend for ETH is still trading within a sideway. Investors should highly focus on the resistance level at 1750 and the support level at 1236 to receive further trading signals.
Resistance level : 1750, 1482
Support level: 1236, 1055
Articles
Contact Us
For general customer related enquiries
+248 4671 948
[email protected]
For legal or regulatory related enquiries