Market Rise on Earning Optimism and Dovish FOMC Speculation
31 October 2022, 08:19

Equity markets took a breather last Friday as investors speculate on a dovish outlook for the Fed after downbeat macro data
Tracking with the gains in the U.S. markets last Friday the Asian markets rose over corporate earnings optimism. The market is speculating that the Fed will surprise the market with a more dovish policy in December, fearing that a too-aggressive tightening policy might push the U.S. into recession. Oil prices saw their 1st monthly gain, ahead of OPEC+ cutting the oil supply in November, and E.U. sanctions on Russia starting in December. The Korean Won has slumped more than 16% in the year, and economists believe that the Won and other Asian F.X.s will continue to be under pressure as the Asian central bank can’t cope with the aggressive U.S. Fed rates hike.
| Look Out For |
Apple’s revenue is better than the market expectation and has gained more than 7%, followed by Microsoft, Alphabet and Meta rose between 1.2% and 3.1%. Caterpillar has also finished the week by gaining 15.3%, the best since the 2008 crisis. The market on the other side is boosted by oil giants like Chevron and Exxon Mobil, up by 1.2% and 2.9% respectively.
| Market Overview |

| Economic Calendar |
|---|

Market Movements

DXY
The Dollar Index, which trades against a basket of six major currencies, is trading higher ahead of a crucial FOMC meeting this week as market participants are currently bracing for another rate hike decision from the Fed. Market participants are widely expected to increase their interest rate for another 75 basis points from the Federal Reserve to combat the sky-high inflation risks. Hence, investors will be scrutinising any hints that the Federal Reserve will start to moderate the rate hike decision following the release of recent downbeat economic data.
On the technical front, the Dollar Index was traded higher following the prior rebound from the previous support level of 109.65. Nevertheless, MACD illustrated diminishing bullish momentum while RSI is at 50, indicating the Dollar Index to continue to trade within a side-way in the short term.
Resistance level: 111.75, 113.45
Support level: 109.65, 107.80

XAU/USD
Gold prices were flat and hovered below $1650 as the markets awaited the upcoming Fed meeting. Markets expect a 75 bps rate hike by the Fed triggered yields to rebound.
From a technical view, the MACD dropped to the zero line, indicating that bullish momentum might have diminished. While the RSI is trading at 40 at the time of writing, it suggests that bearish momentum is ongoing.
Resistance level : 1674, 1729
Support level : 1617, 1569
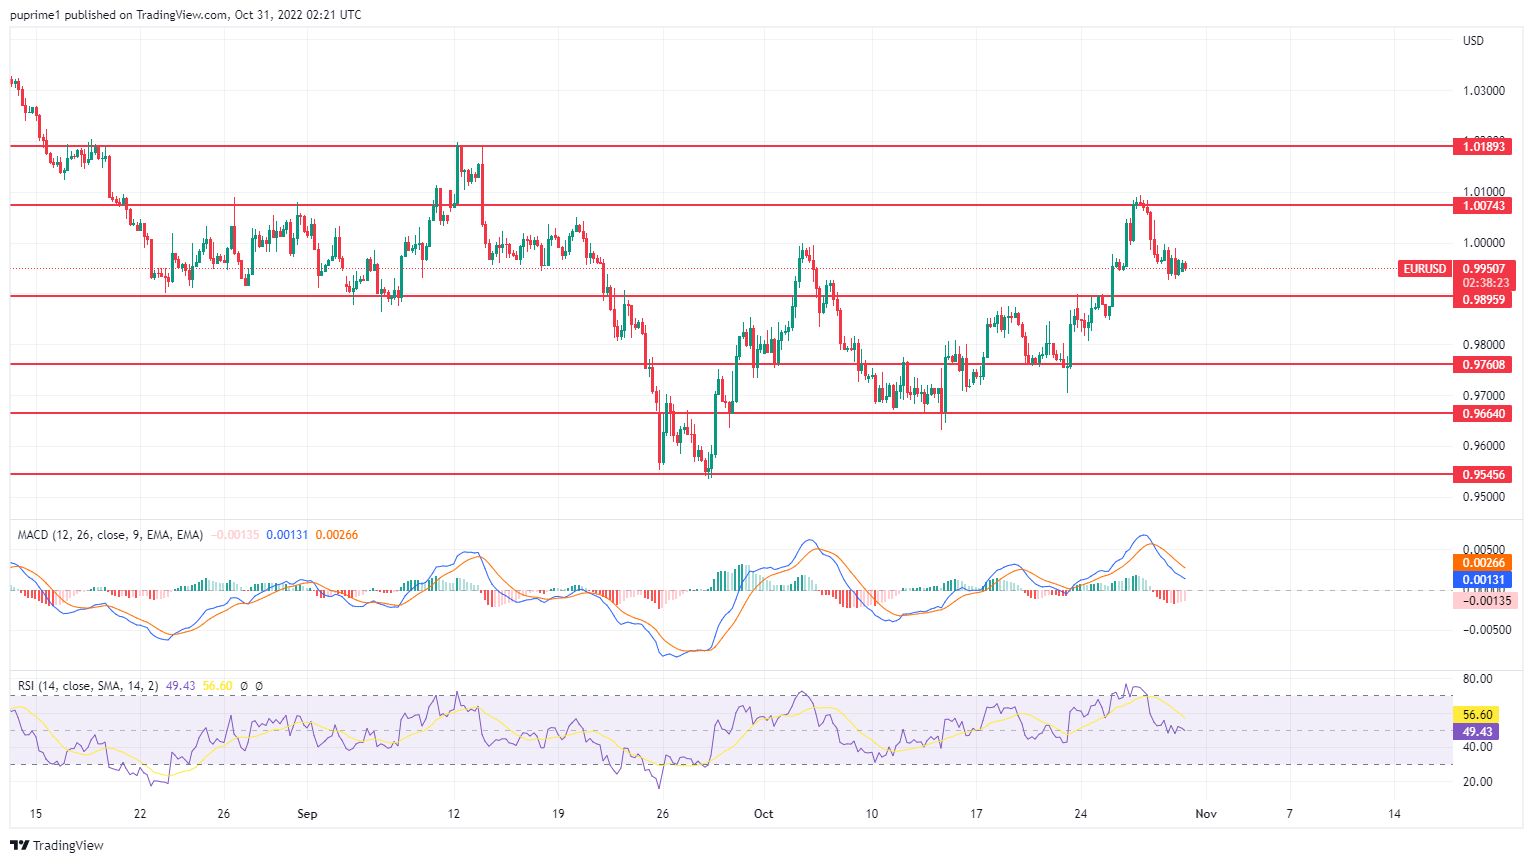
EUR/USD
The appreciation of the US Dollar, supported by the rate hike expectation from the Federal Reserve, has spurred further bearish momentum on other regional currencies, such as EUR/USD, on a relative basis. Nonetheless, the long-term prospect for the Euro remained positive over the backdrop of upbeat economic data from the European region. According to the Federal Statistical Office, Germany, Germany’s Consumer Price Index (CPI) and the Gross Domestic Product (GDP) YoY both came in at 10.4% and 0.3%, which both fared better than market expectations at 10.1% and 0.70%, respectively.
On a technical view, the Euro was traded lower following prior retracement from the resistance level at 1.0075. MACD had signalled a diminishing bearish momentum, while RSI, at 49, suggested the pair would likely trade sideways in the short term as a technical correction.
Resistance level: 1.0075, 1.0190
Support level: 0.9895, 0.9760
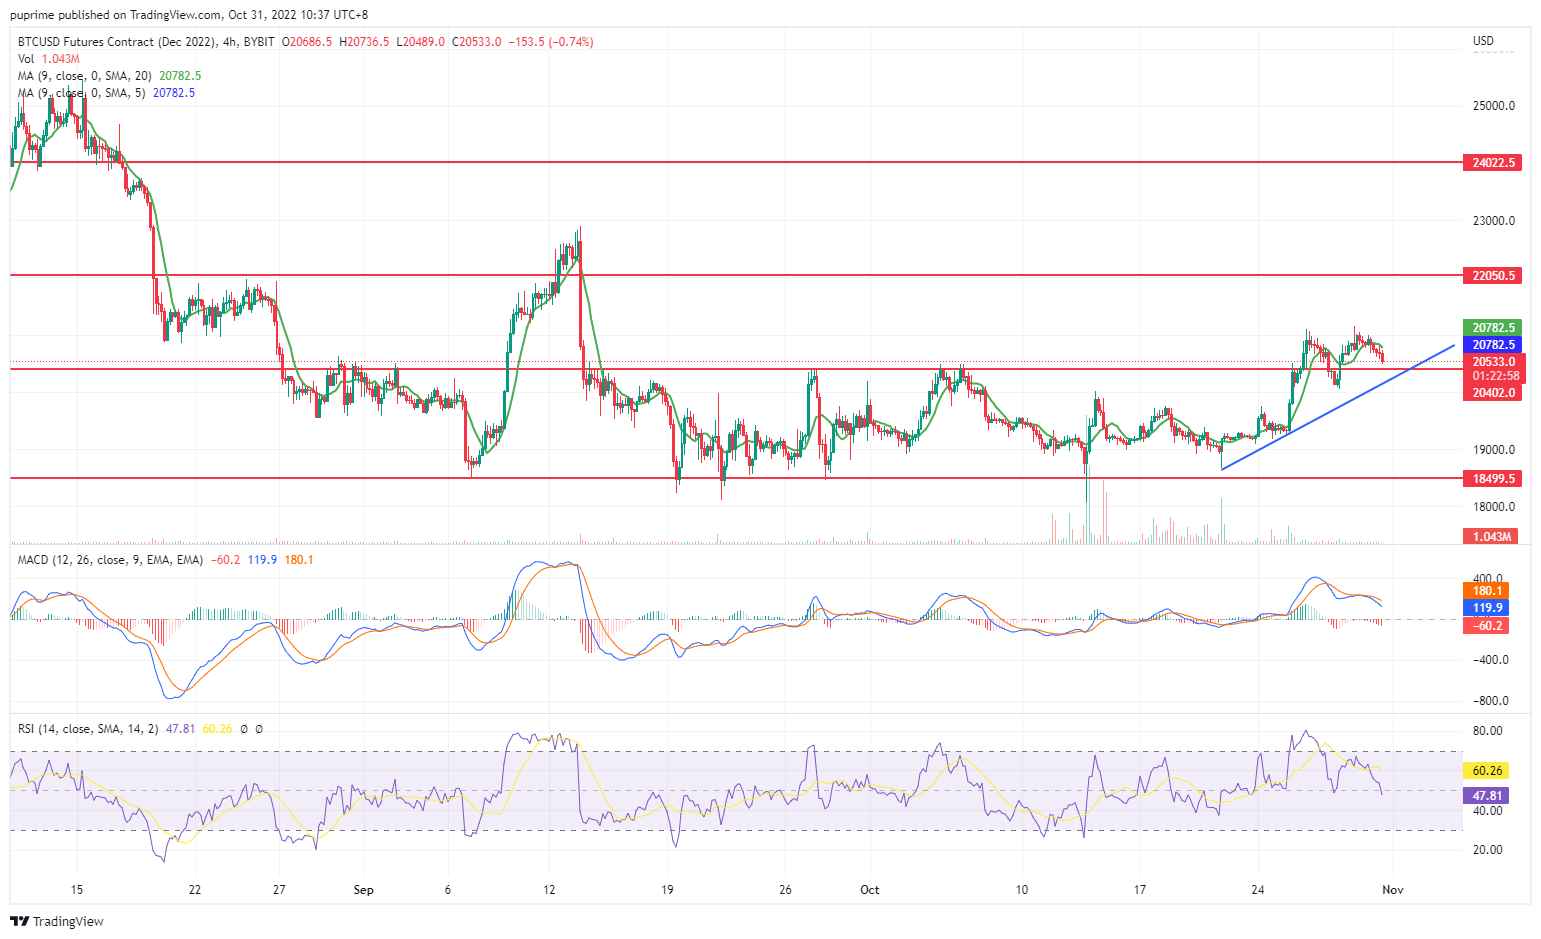
BTC/USD
Fortunately, by following the footstep of the strong U.S. equities market, BTC has surged above the psychological level at 20400, where previously, it has been a strong resistance in the past month. However, the hawkish monetary policy will constantly pressure BTC, so a strong and bullish momentum will be in doubt.
Although BTC has been now trading above the level of 20400 but it seems like BTC has a diminishing momentum and it is restrained at around 21100. Macd has also fallen back to near zero line, and the RSI falls back to 47 as of writing. Both indicators suggest that the bullish momentum for BTC is halted, and the chance for it to continue to surge is minimal.
Resistance level: 22040, 24050
Support level: 20400, 18500

DJ30
The Dow Jones continues to receive significant bullish momentum, experiencing its best month since 1976. Following a less hawkish expectation from the Federal Reserve, despite a mixed third-quarter earnings season from major companies with few significant disappointments from the US large tech companies’ financial report. Investors are preparing for the latest Federal Reserve meeting, which is set to begin on Tuesday. The central bank is expected to increase its interest rate by 75 basis points. Still, many investors would be focusing on a signal from the Federal Reserve’s press conference to gauge the likelihood of a rate hike decision from the Federal Reserve.
From a technical view, the DJ30 extended its gains while currently near the resistance level. MACD illustrated increasing bullish momentum while RSI is at 79, suggesting the stock index is in overbought territory.
Resistance level: 33065, 34320
Support level: 31045, 29805

GBP/USD
The pound broke the past resistance of 1.15 and moved upward to 1.16, as supported by the appointment of Rishi Sunak as prime minister last week. However, the pair remains to be seen as BoE is expected to raise its interest rates over the next three months.
From a technical perspective, MACD was hovering above the zero line, which indicates a bullish momentum might continue. At the same time, RSI ranges around 63, which suggests a bullish momentum.
Resistance: 1.1727,1.1914
Support: 1.1477, 1.0973

USD/JPY
The Japanese Yen received a selloff following the Bank of Japan (BoJ), leaving its quantitative easing program unchanged, in contrast with its hawkish global peers that are undertaking aggressive rate hike decisions to stabilise the global inflation risk. According to the monetary policy statement, the central bank will continue with its quantitative monetary easing program with effective yield curve control, aiming to achieve inflation stability of 2%.
From the technical perspective, the pair was traded higher following the prior breakout above the previous resistance level. Meanwhile, MACD, which illustrated increasing bullish momentum, and RSI surged above the middle line and hovered around 55, which suggests the pair is likely to extend its gains toward the resistance level.
Resistance level: 149.25, 151.65
Support level: 147.60, 145.90
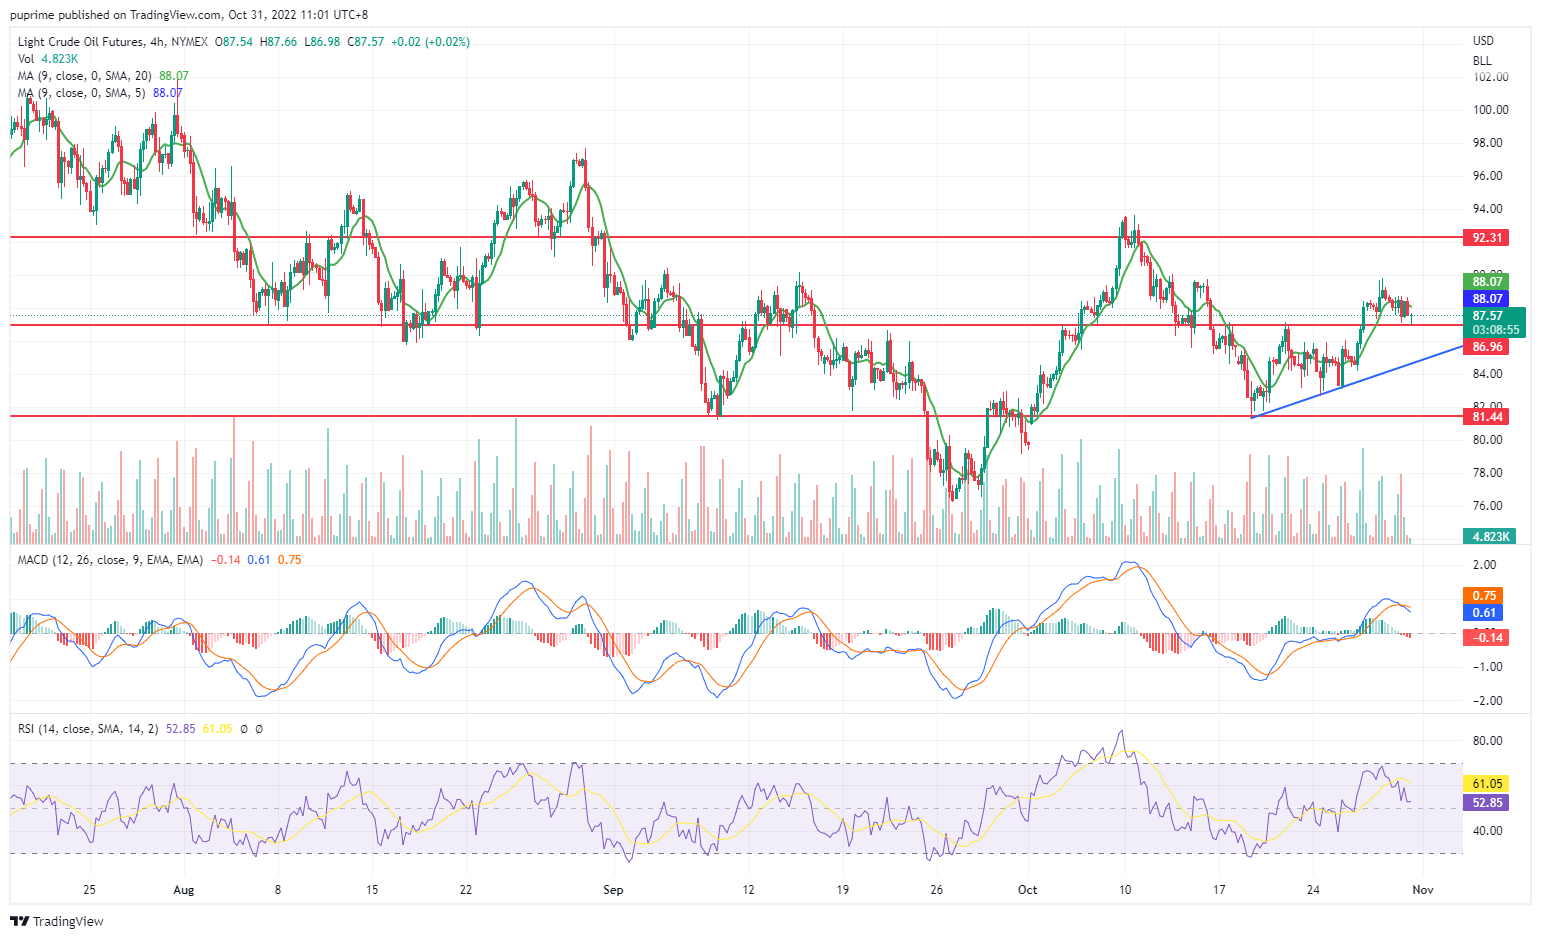
Crude oil
Oil prices will likely have a monthly gain of more than 12% in October. With OPEC+ nations starting oil production cuts in November and E.U. also stopping taking Russian oil in December, the oil market will be more volatile and bullish at the year-end.
MACD and RSI have depicted a slowdown in bullish momentum for crude oil, where MACD dropped to near zero line, and RSI is hovering at around 50. The oil price has been steadily trading above the support level at 87, and any catalyst might decide the direction of the crude oil.
Resistance level: 92.30
Support level: 87.00, 81.45
Articles
Contact Us
For general customer related enquiries
+248 4671 948
[email protected]
For legal or regulatory related enquiries