Markets Positive Over Potential Government Gridlock
9 November 2022, 06:29

Republicans are in favour to win the US election midterms, and investors are taking that as positive
What You Need to Know
The U.S. midterm election result is yet to be announced, but there is a potential for government gridlock should the Republicans take control of the House and Senate. Markets perceived the news positively, since a gridlock would reduce uncertainty around fiscal spending and tax reforms, leading to U.S market rising last night. Meanwhile, there is turbulence in the cryptocurrency markets as the crash of altcoin FTT, has caused Bitcoin and other cryptocurrencies to tumble. FTT plunged nearly 80% in a day and wiped out over $2 billion in value. Oil prices dropped slightly as the oil’s tight supply has been overshadowed by a rise in Covid cases in China.
| Look Out For |
Current rate hike bets on 14th December Fed interest rate decision:
75 bps (45.6%) VS 50 bps (54.4%)

Market Movements
DXY
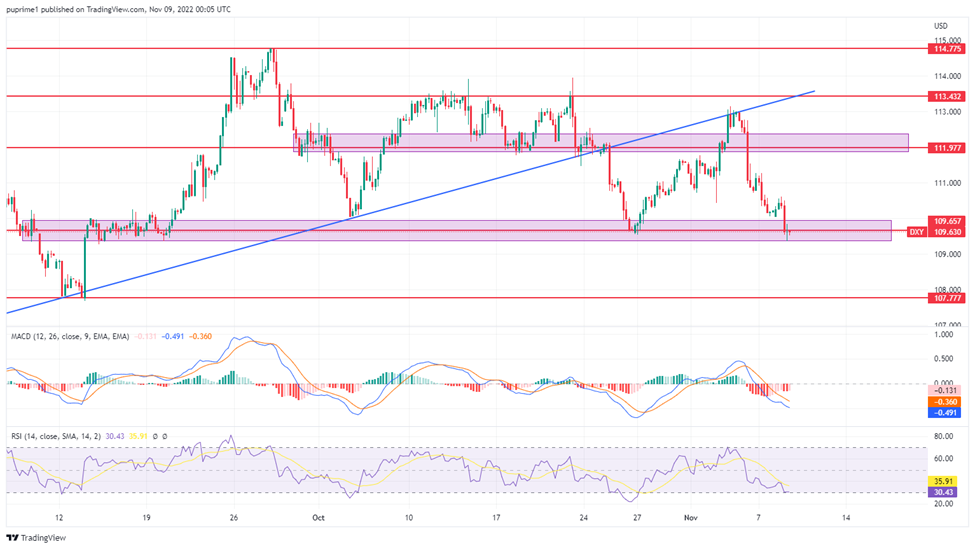
The Dollar Index hovered near the 10-day low with market participants remaining cautious about the US midterm election as US voters were deciding whether to grant Republicans control of Congress. The Republican party has put spiking inflation front and centre in their campaign and pinned the blame on President Joe Biden and his party. Heightened political tensions continue to be the wildcard shaking investors’ sentiment in the United States.
On the technical front, the Dollar Index is trading lower while currently testing the support level at 109.65. Nevertheless, MACD has illustrated diminishing bearish momentum, while RSI is at 30, indicating the product is going into oversold territory.
Resistance level: 111.95, 113.45
Support level: 109.65, 107.75

XAU/USD
The safe-haven gold surged significantly at the start of what may be another volatile week for US markets amid the US mid-term election and Consumer Price Index (CPI) data. Market participants continue to be concerned about the heightened political tensions, which will likely spark further uncertainty in the US financial market and stoke a shift in sentiment toward other safe-haven assets such as gold. As for now, investors will continue to eye on such developments for further trading signals.
The gold market is trading higher following the prior breakout above the previous resistance level at 1681.85. However, MACD has illustrated diminishing bullish momentum, while RSI is at 73, indicating that the commodity is going into an overbought area.
Resistance level: 1677,1733
Support level: 1615,1569

EUR/USD
Euro continues its bullish momentum following Germany’s short-term yield hitting fresh multi-year highs yesterday, with market participants focusing on the rate hike policy from the European Central Bank to combat the spiking inflation rate. In the Eurozone, consumer inflation is at a record-breaking 10%, adding further pressure to economic development. The European Central Bank policymaker Joachim Nagel claimed that significant rate hikes were necessary to stabilise the high inflation rate.
EUR/USD is trading higher while currently testing the resistance level at 1.0085. Nonetheless, MACD has illustrated diminishing bullish momentum, while RSI is at 68, suggesting a sign that the pair might be traded lower in the short-term as RSI retreated sharply from overbought levels.
Resistance level: 1.0085, 1.0190
Support level: 0.9875, 0.9750

BTC/USD
Bitcoin has slumped by 12% in the last 24 hours, trading at $18165 as of writing. The cryptocurrency market crashed yesterday because Binance signed a nonbinding agreement to buy crypto exchange FTX to help cover a liquidity crunch at the rival exchange. The deal between Binance and FTX has drawn speculation over FTX’s financial health, resulting in an accumulation of nearly $6 billion of withdrawals in the 72 hours before Tuesday morning. However, major cryptocurrencies like bitcoin rallied at the news but quickly retracted and dropped further.
The MACD line is slipping downward as of writing, indicating a strong bearish momentum ahead. RSI is breaking through 30, which has already descended to the oversold zone, currently trading at 18.65, showing a massive selling for the coin. Investors can keep an eye on the following crucial support level around $17000.
Resistance level: 20461, 25141
Support level: 17000, 12070

DJ30
Dow Jones was up by 333.83 points or 1.02% to hit a one-month high as US stocks edged higher on Election Day. A lot of so-called ‘Republican stocks’ rose, although the Donald Trump-linked SPAC, Digital World Acquisition Corp, fell. Polls show that the Republicans are likely to take the House, this would be the reason for the market to go up. Besides that, markets are keeping an eye on the CPI data on Thursday, which, if the inflation eases more than expected, could be a sign that the Fed could pivot on policy or vice versa. This would affect the decision of the Fed to tune the interest rate hike to curb the inflation rate.
MACD is hovering above the zero line on the technical front, and it remains in a bullish zone. However, RSI is trading above 70 at the overbought zone. It generates a sell signal and suggests that the index is overbought as of writing.
Resistance level: 33025, 35456
Support level: 30638, 29041

GBP/USD
Cable gained some advantage over a weak dollar as the DXY index dropped below 110 for the first time in November. But how much Cable could benefit from the dollar weakness is in doubt while the market is awaiting the economic plan from the newly appointed PM.
From the technical view, the MACD shows a bullish momentum as it surpassed the zero line and the gap between the MACD line and the Signal line is widening. On the other hand, RSI is steadily climbing and staying above 60 as of writing, signalling a bullish momentum for Cable as well.
Resistance:1.1634 , 1.2000
Support: 1.1133, 1.0809

USD/JPY
The dollar is down for the 3rd continuous day and the DXY is traded below 110 for the 1st time in November which indirectly led to a stronger Yen. High anticipation that the FOMC will slow down its hawkish policy approach will also favour the Yen to go stronger against the dollar.
The pair has been consolidating between the range of 145.805 to 148.77 for the past 2 weeks and is finally breaking the channel downward. The MACD is moving below the zero line and the MACD histogram stays below the baseline, suggesting a bearish signal ahead. RSI is moving downward approaching 30 which also implies a strong selling power for the pair.
Resistance level: 145.805, 148.77
Support level: 143.725, 140.724

CL OIL
Crude oil prices fell significantly in chopping trading on growing concerns about the fuel demand following the Covid-19 outbreaks worsening in top crude importer China. New Covid-19 cases have surged dramatically in Guangzhou and other Chinese cities, dimming prospects for easing restrictions. Besides, the oil prices extend their losses against the backdrop of downbeat inventory data. According to the American Petroleum Institute, US API Weekly Crude Oil Stock increased significantly from the previous reading of -6.530M to 5.618M, much higher than the market forecast at 1.100M.
Crude oil prices have formed a double-top signal following a breakout below the support level of 89.65. MACD has illustrated increasing bearish momentum, while RSI is at 39, suggesting the downside is more favoured as the RSI stays below the midline.
Resistance level: 89.65, 92.60
Support level: 86.80, 83.05
Articles
Contact Us
For general customer related enquiries
+248 4671 948
[email protected]
For legal or regulatory related enquiries