WTI and Brent oil both plummeted Thursday after Biden’s decision to release 180 million barrels of crude oil
1 April 2022, 02:42
Market Focus
US equity markets tumbled at the end of the day, wrapping up their first negative quarter since the pandemic. The S&P 500 lost the most, declining 1.57%. The Dow Jones Industrial Average dropped 1.56% while the Nasdaq Composite closed down 1.54%. Moves in most financial markets were muted on the last day of the quarter as investors eyed the threats of a hawkish Fed and the war between Russia and Ukraine.

In the bonds market, the 2-year Treasury yield gained after a 150 basis- point, the most upside move since 1984. The 10-year Treasury yield slid to 2.34%, narrowing the spread to shorter tenors, as investors continued to remain on edge over a restrictive Fed.
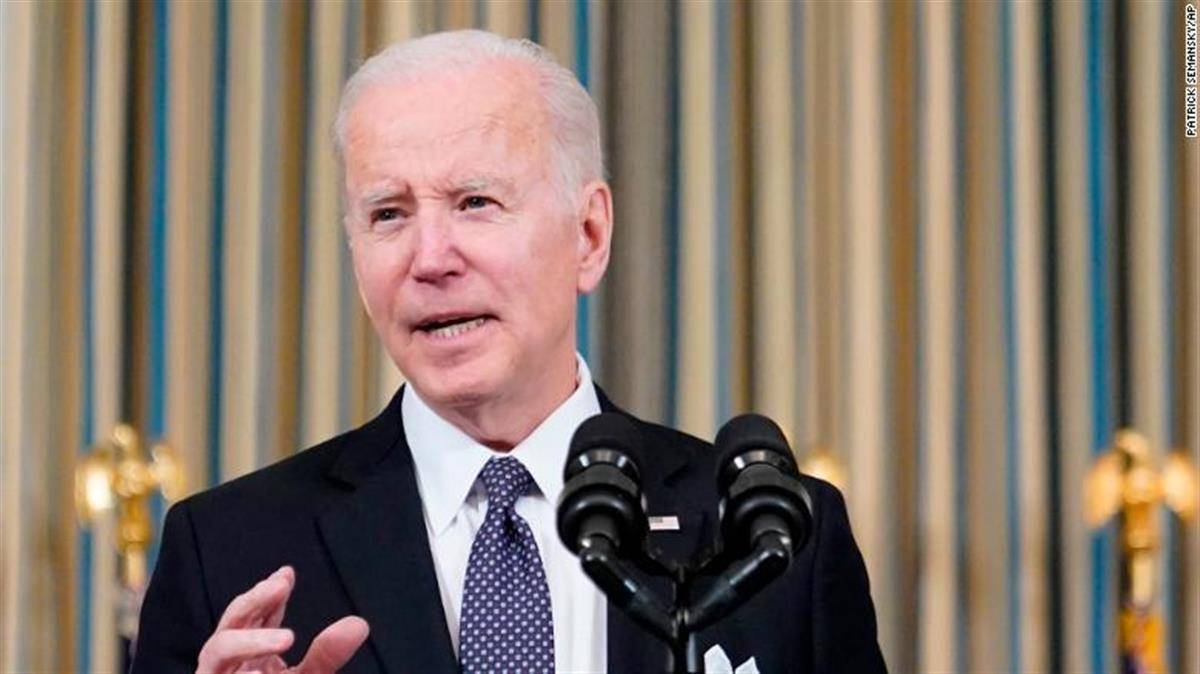
US President Joe Biden delivered his message regarding the release of oil reserves on Thursday. Biden ordered an unprecedented release of emergency US crude oil, gambling on his climate-saving credentials during his election. It is indeed a remarkable shift for Joe Biden as he has promised to combat climate change. In the space of a week, he has decided to release 180 million barrels of crude oil from the US stockpiles.

Main Pairs Movement
The Aussie depreciated against the US dollar as Australia imposes tariffs on Russian imports. At the same time, the Aussie remains pressured by the contraction in Chinese business PMIs. At the end of the day on Thursday, AUDUSD declined 0.35% and is trading at 0.74823.
WTI and Brent oil both tumbled on Thursday following Joe Biden’s strongest endorsement of oil. WTI and Brent oil dropped 5.81% and 5.86%, respectively, defending the $100 per barrel level.
USDJPY consolidated around the 121.60 level. The currency pair seesawed amid mixed messages that Japan’s authorities would intervene and respond to the recent sharp depreciation along with the fading hope for diplomacy in Ukraine.
EURUSD plunged nearly 1% and is trading at 1.10665 on the news of higher EU unemployment rates. The eurodollar was in a negative stance right after the economic data that showed that the EU’s unemployment rate was higher than expected, 6.8% versus 6.7%.
Technical Analysis
GBPUSD (4-Hour Chart)

Cable closed 0.32% higher after the previous trading day and continued to march higher on the backdrop of broad-based Dollar weakness. The U.S. initial jobless claims came in slightly above market consensus, causing short term volatility in the Greenback. The Dollar Index ebbed 0.5% after the news broke, but the Dollar soon met demand as news broke that the previously presumed positive sentiment shift between Ukraine and Russia seems to have been false. Further selling pressure could surround Cable shall Russia go against its previous commitment to reduced military actions.
On the technical side, Cable retreated from our previously estimated resistance level of 1.3163 and is now consolidating near our previously estimated support level of 1.3131. RSI for Cable sits at 50.56, as of writing. On the four hour chart, Cable is trading below its 50, 100, and 200-day SMAs.
Resistance: 1.3163
Support: 1.3131, 1.3057
EURUSD (4-Hour Chart)

EURUSD rose 0.66% over the course of the previous trading day, but the pair has since lost all of its gains from the previous day and is now trading in negative territory. With British Intelligence and other media outlet sources suggesting that Russia’s commitment to reduced military actions was false, the Euro bore heavy selling pressure. Despite higher-than-estimated jobless claims figures coming out of the U.S., the euro could not take advantage of the bearish sentiment surrounding the dollar. As previously noted, the euro continues to be disfavored against the Greenback due to ongoing geopolitical conflicts and long term interest rate differentials.
On the technical side, EURUSD has fallen sharply from its previous day’s close and is now trading below our previously estimated resistance level of 1.1216. RSI for the pair sits at 51.3 as of writing, indicating some supportive buying at the current pricing level. On the four hour chart, EURUSD is trading above its 50 and 100-day SMAs but below its 200-day SMA.
Resistance: 1.1216
Support: 1.0985, 1.0845
XAUUSD (4-Hour Chart)

Gold rose 0.68% over the course of the previous trading day and is continuing to move higher as tensions between Ukraine and Russia build up once more. The previously assumed de-escalation between Ukraine and Russia has been proven false by European officials, and market participants have once again rotated into the precious metal in search of safety. Gold’s upward momentum was aided by the general weakness of the dollar, as the U.S. posted disappointing jobless claims figures. Gold prices continue to fluctuate above the $1900 per ounce psychological barrier and there is no foreseeable timeline that gold prices would return to normal pricing.
On the technical side, XAUUSD rebounded strongly from our previously estimated support level of $1918 per ounce and is now closing in on $1950 per ounce. RSI for the precious metal has been on the rise and sits at 60 as of writing. On the four hour chart, XAUUSD is currently trading above its 50, 100, and 200-day SMAs.
Resistance: 1947
Support: 1918, 1886
Articles
Contact Us
For general customer related enquiries
+248 4671 948
[email protected]
For legal or regulatory related enquiries