Stock Sink as Bond Yields Rise – What’s Next?
4 November 2022, 05:56

What You Need to Know
Major tech stocks tumbled and dragged the U.S. equities market down while the Fed is expected to hold rates up high for longer to tame inflation. Meanwhile, the Treasury yield curve inversion has reached a 4-decade extreme, with the spread between the 2 and 10-year notes hitting a high at 58bps. The Sterling, and U.K.’s long-date bonds tumbling as the BoE signals to raise the rates less than the market expected. Concerns over the global economic slowdown and central banks increasing rates have overshadowed the tightening oil supply as oil prices fluctuate with a bearish bias.
| Look Out For |
Current rate hike bets on 14th December Fed interest rate decision:
50 bps (52.0%) VS 75 bps (48.0%)
| Market Overview |

| Economic Calendar |
|---|

Market Movements

DXY
The Dollar Index, which trades against a basket of six major currencies, surged after the release of overwhelming economic data from the United States yesterday. According to the Department of Labour, the US Initial Jobless claims came in at 217,000, better than the market expectation of 220,000, and hovering around historically low levels. The still-low level of jobless claims indicates that the labour market in the United States remains solid, boosting hawkish expectations of the Federal Reserve. As for now, market participants will continue to eye on the crucial Nonfarm Payroll data, which will be released tonight for further trading signals.
The Dollar Index is trading higher while currently trading nearby the resistance level of 113.45. MACD has illustrated diminishing bullish momentum, while RSI is at 65, suggesting the index’s outlook is bearish in the near-term as the RSI retreated sharply from overbought levels.
Resistance level: 113.45, 114.75
Support level: 111.95, 109.65
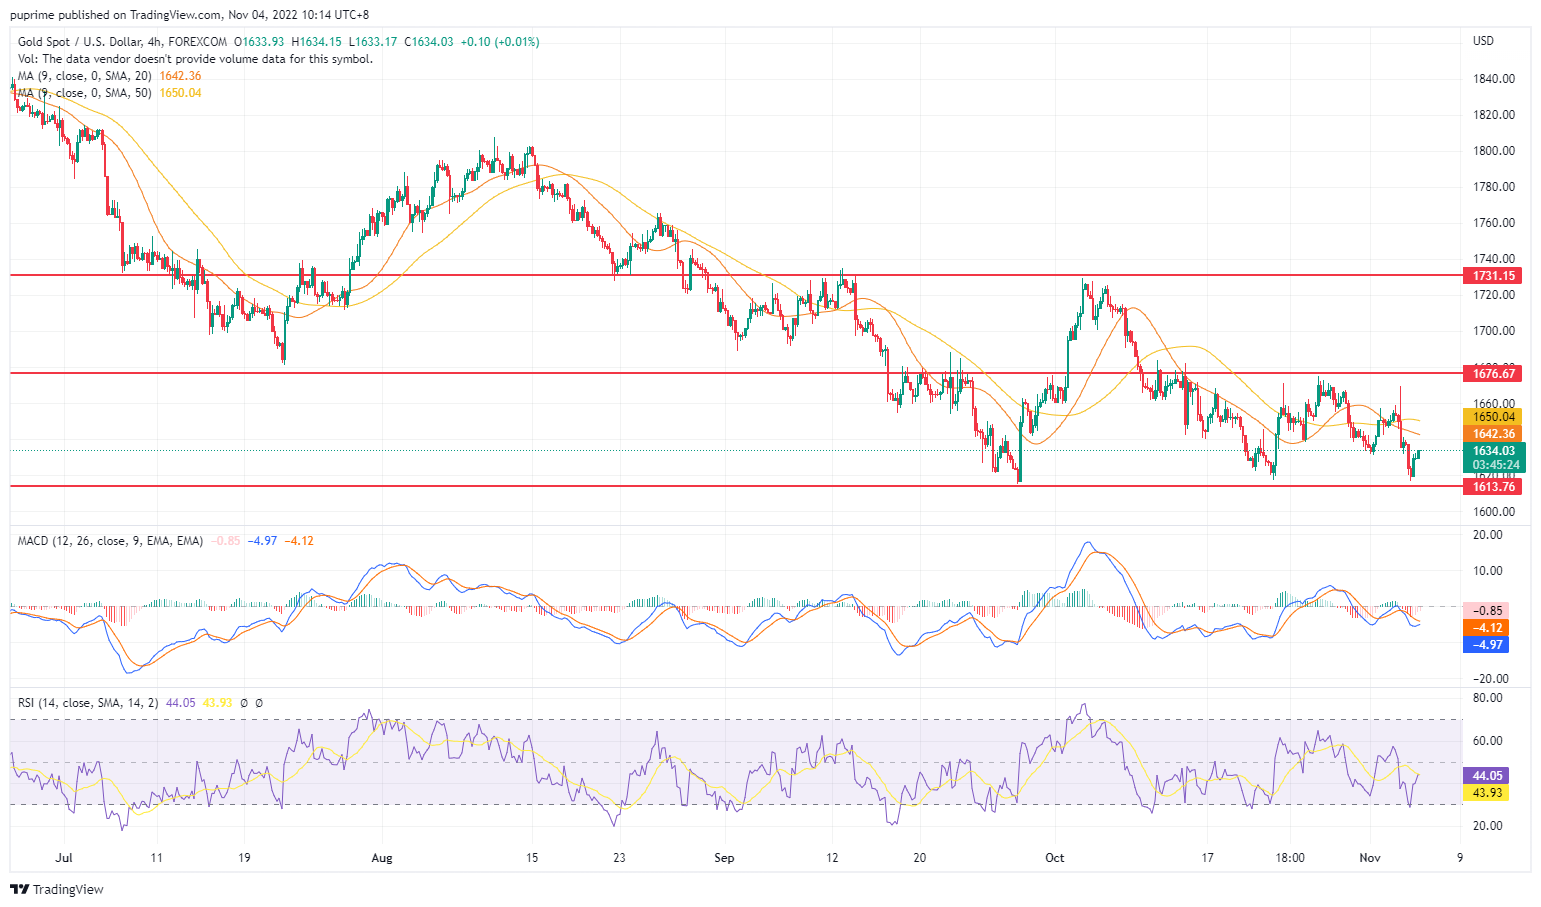
XAU/USD
Gold prices fell 1% to $1634 on Thursday, weighed down by the Fed announcing that it could start raising rates in smaller increments in future. Gold is considered an inflation hedge, but rising interest rates dent the non-interest bullion’s attractiveness. Investors focus on October’s US non-farm payroll data, which could signal the Fed’s rate hike plan.
MACD is hovering below zero, which indicates bearish momentum continues. On the other hand, RSI is trading below 50, suggesting that the movement of the gold prices is in a bearish direction.
Resistance level : 1676, 1731
Support level : 1613, 1569

EUR/USD
Due to the lack of market catalysts from the European region yesterday, the overall bearish momentum of EUR/USD was primarily due to the strengthening US Dollar. Recently, hawkish statements from the Fed and upbeat economic data from the United States have put pressure on other regional currencies on a relative basis, continuing to weigh down the market demand for EUR/USD.
From the technical viewpoint, EUR/USD is trading lower while currently testing the support level at 0.9750. Nonetheless, MACD has illustrated diminishing bearish momentum, while RSI is at 35, suggesting the upside is more favoured as the RSI rebounds sharply from oversold territory.
Resistance level: 0.9875, 1.0075
Support level: 0.9750, 0.9665
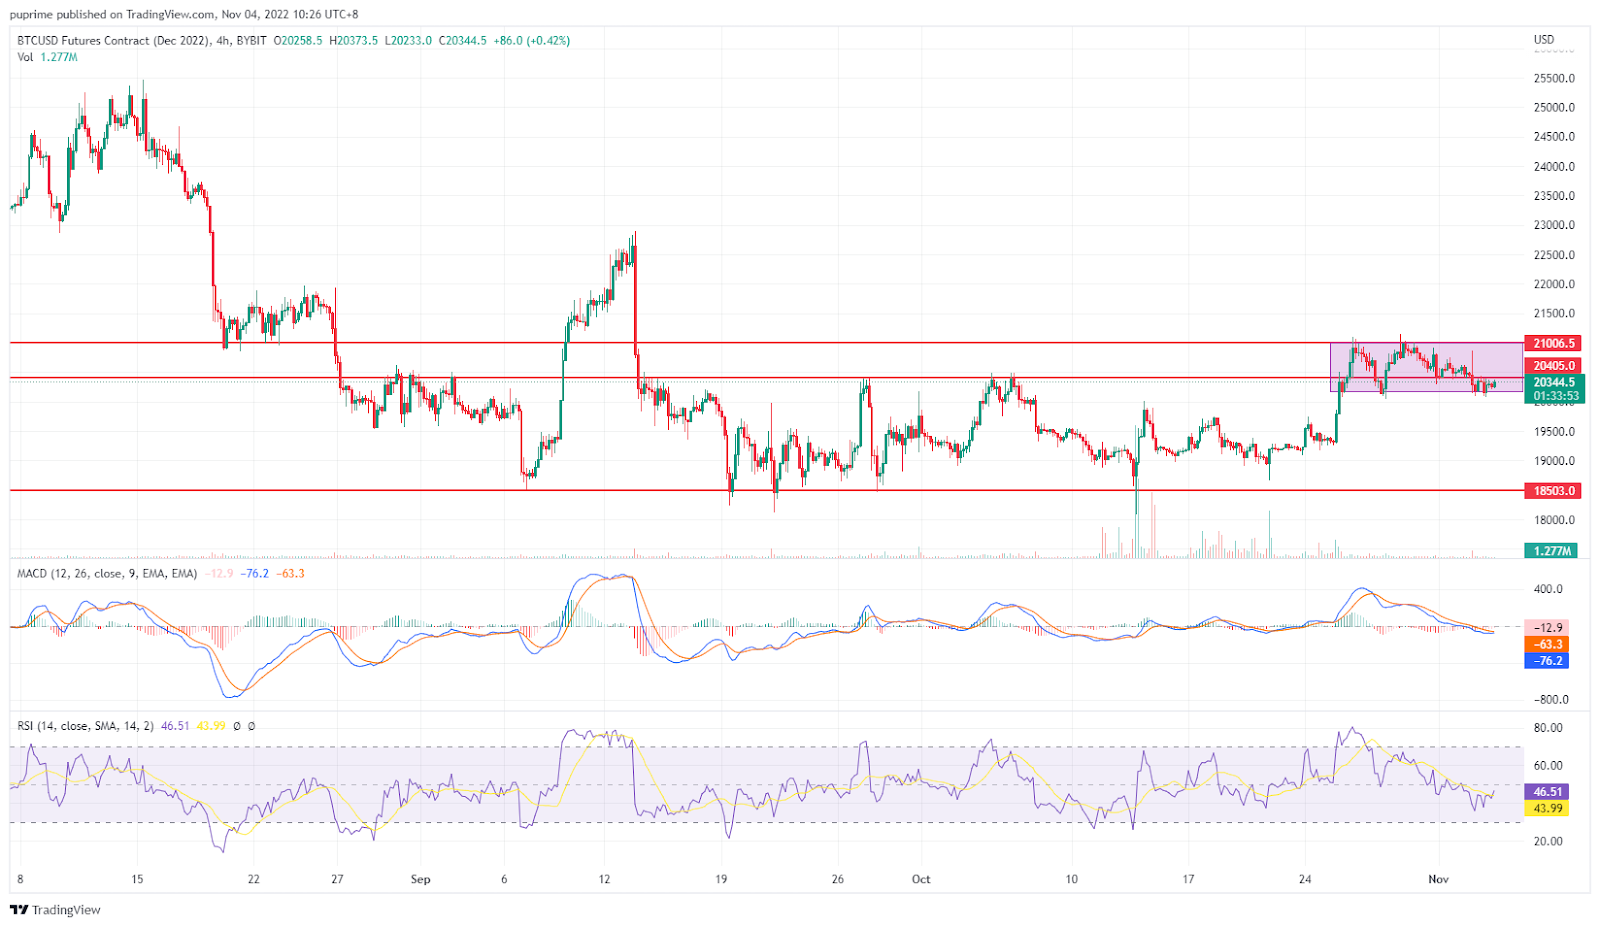
BTC/USD
Since the Fed raised the most considerable rate for the 4th straight time in a row, the DXY index has surged by over 3% from its recent lows. It is believed that BTC has an inverse relationship with the DXY index, where a rise in the DXY index will signal a drop in BTC.
For the past 9 trading days, BTC has been trading in a relatively small range between 20160 to 21000. The MACD lines are narrowed below the zero line, and the RSI hovers around 46. Both indicators have no signal for either direction, and a very low trading volume suggests that the market needs to wait for a catalyst to predict better which direction the coin will move next.
Resistance level: 21050, 22040
Support level: 20400, 18450

DJ30
The Dow Jones edged lower for a fourth consecutive session. The recent positive economic data and hawkish policy from the Federal Reserve have sent the positive-sensitive 2-year US Treasury yield climbing to its highest level since July 2007. Market participants are looking ahead to Friday’s October Nonfarm Payrolls report for fresh clues into the health of the US economy.
The DJ30 is trading lower following a prior retracement from the resistance level. MACD has illustrated increasing bearish momentum, while RSI is at 56, suggesting the downside is more favoured as the RSI retraces sharply from overbought territory.
Resistance level: 33065, 34320
Support level: 31045, 29805

GBP/USD
The pound sank sharply by 2% to 1.12 after the announcement of the monetary policy from the BoE. BoE delivered its biggest rate hike to 3% since 1989 as it warned investors that it might push back against market expectations for future rate hikes, saying that the consequences would induce a two-year recession.
MACD shows a slip from the zero line, indicating a strong bearish momentum for the pound as of writing. RSI also dropped to 31, which indicates a bearish momentum near the oversold zone.
Resistance: 1.1464,1.7792
Support: 1.2931, 1.0396
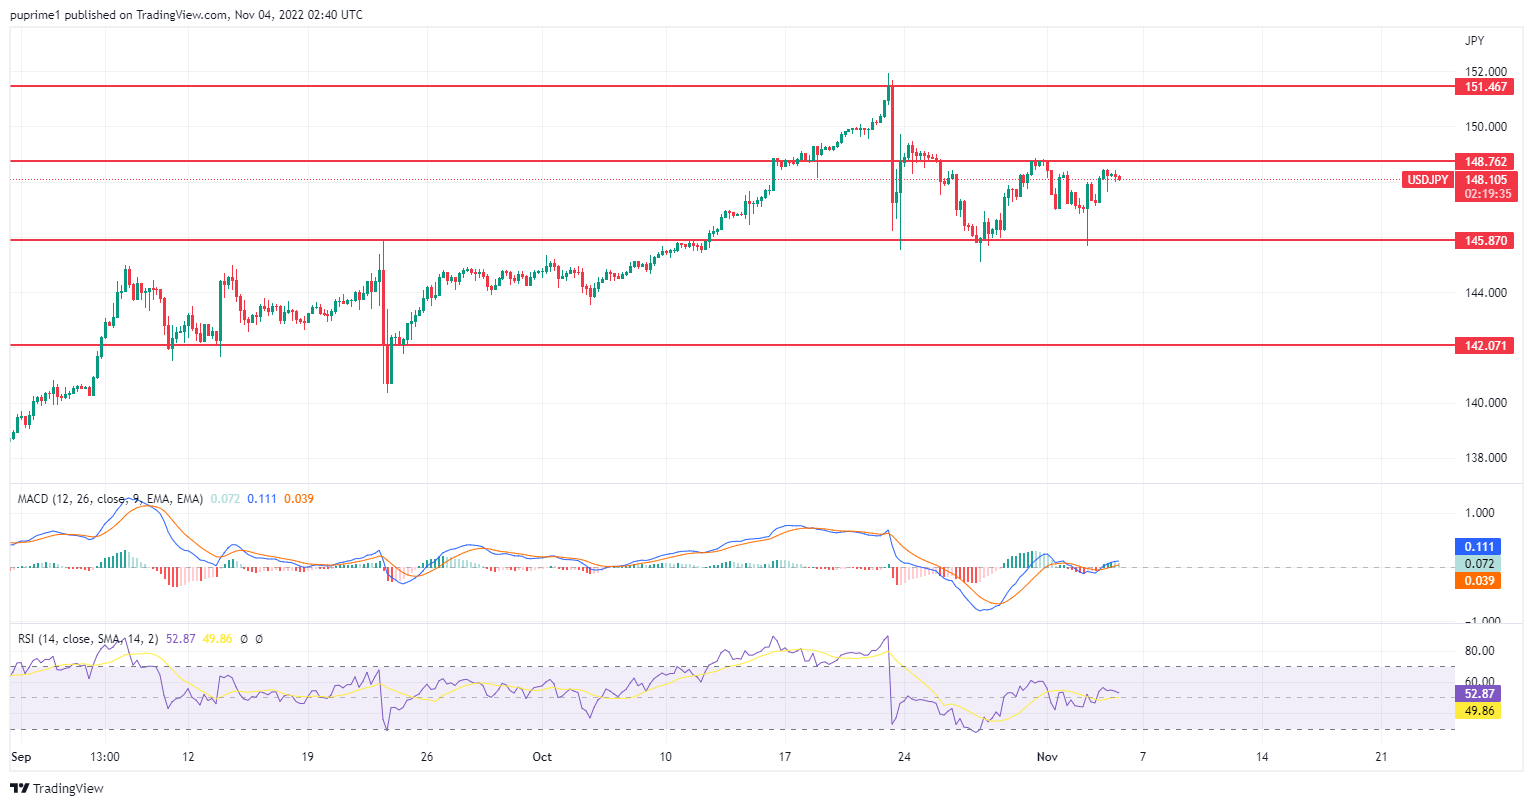
USD/JPY
The strong US Dollar, supported by the Fed’s aggressive monetary tightening to stabilise inflation, has widened the policy divergence with the Bank of Japan (BoJ) while insinuating bullish momentum on the USD/JPY. As for now, investors continue to scrutinise any further monetary intervention to shore up the Japanese Yen from the Bank of Japan (BoJ). Earlier, the Bank of Japan (BoJ) spent a record $42.8 billion to stabilise the Yen last month.
USD/JPY is trading higher while currently testing the resistance level at 148.75. Nonetheless, the gap between MACD indicators has narrowed while RSI is presently near the midline, suggesting a sign that the pairs will continue to trade sideways between the level of 148.75 and 145.85.
Resistance level: 148.75, 151.45
Support level: 145.85, 142.05

Crude oil
Oil prices slid to below 89 as the market worries about China’s oil demand and global economic slowdown. Major central banks have kept increasing their rates to tame inflation, which will also pressure the oil price.
Although some fundamental factors will hinder oil prices from surging higher, it is still trading in its uptrend support line. The MACD line moves flat above the zero line, and the RSI hovers in a small range of around 50. Both indicators suggest that the oil price may be consolidating for a while.
Resistance level: 90, 93.7
Support level: 86, 81.5
Articles
Contact Us
For general customer related enquiries
+248 4671 948
[email protected]
For legal or regulatory related enquiries