US Bond Yields Surge in Face of Further Rate Hikes
1 November 2022, 05:59
Further Fed hawkishness has spurred a jump in Treasury yields and a downturn in gold.
What You Need to Know
Treasury bond yields climbed higher, reflecting that the market has priced in the Fed’s aggressive rate hike to tame inflation. Perhaps stimulated by the rebound in U.S. tech stocks, tech shares on the HSI led Hong Kong’s market to rebound from its decade-low. Japanese shares closed high as well as the weakness of the Yen is supporting the nation’s exports. On the other hand, even though Japanese authorities have spent a record 6.3 trillion Yen to support the currency, the Yen is back to near the 150 level against the USD.
| Look Out For |
Current rate hike bets on 2nd November Fed interest rate decision:
75 bps (85.5%) VS 50 bps (14.5%)
| Market Overview |

| Economic Calendar |
|---|

Market Movements
DXY
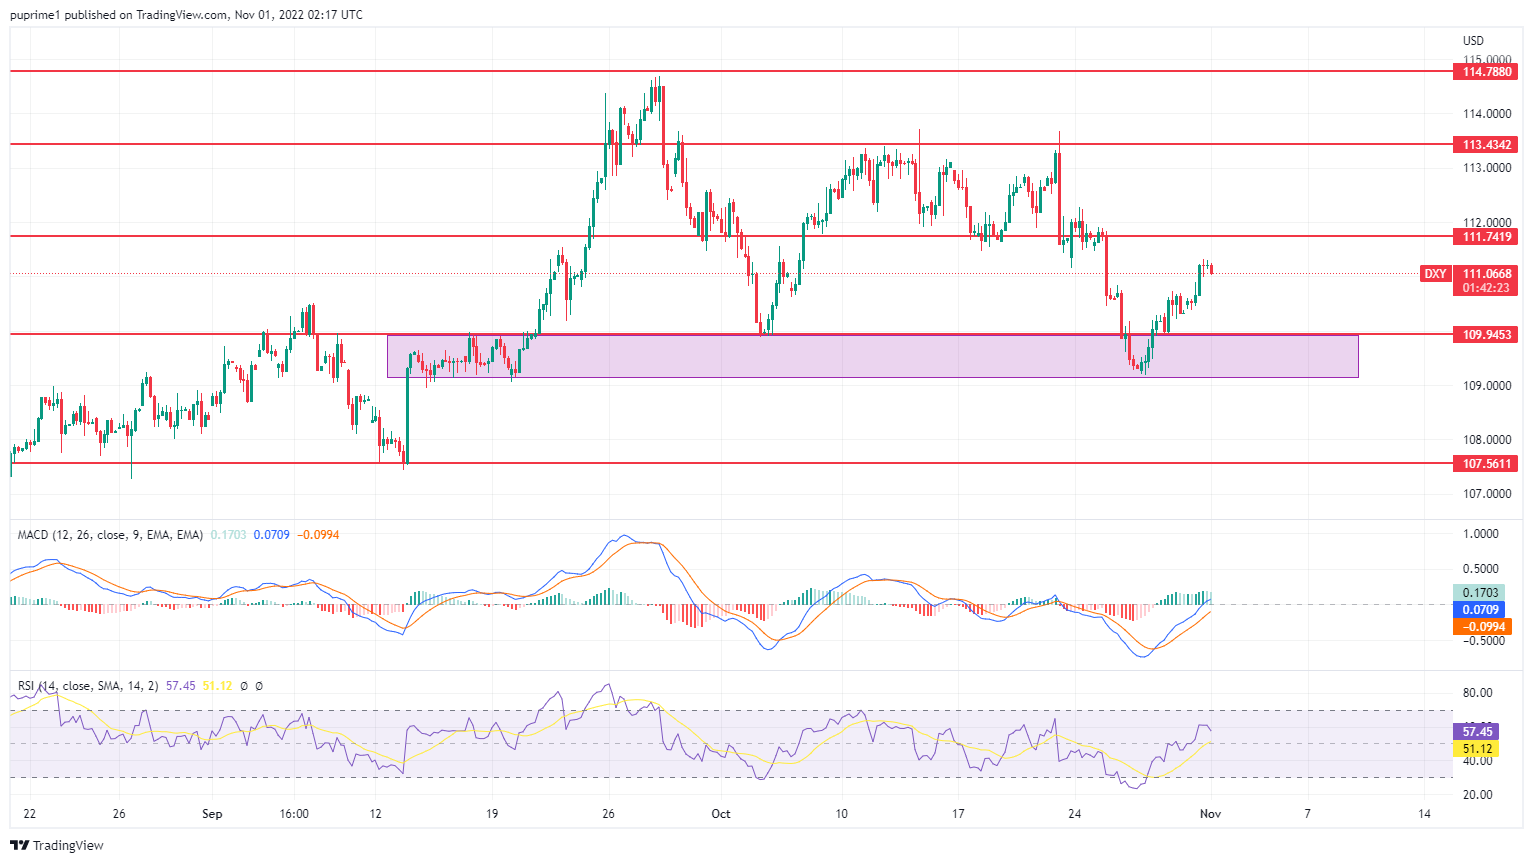
The Dollar Index extended its gains yesterday as investors re-assessed the FOMC meeting by this week. Market participants widely expect that the Federal Reserve would raise its interest rates by 75 basis points on Wednesday at the conclusion of its two-day policy meeting. However, investors will continue to scrutinise further statements from the member of the Federal Reserve to receive future trading signals.
On the technical front, the Dollar Index was trading higher following the prior rebound from the support level. MACD illustrated increasing bullish momentum while RSI is at 57, suggesting a neutral-to-bullish stance as the RSI stood above the midline.
Resistance level: 111.75, 113.45
Support level: 109.95, 107.55
XAU/USD
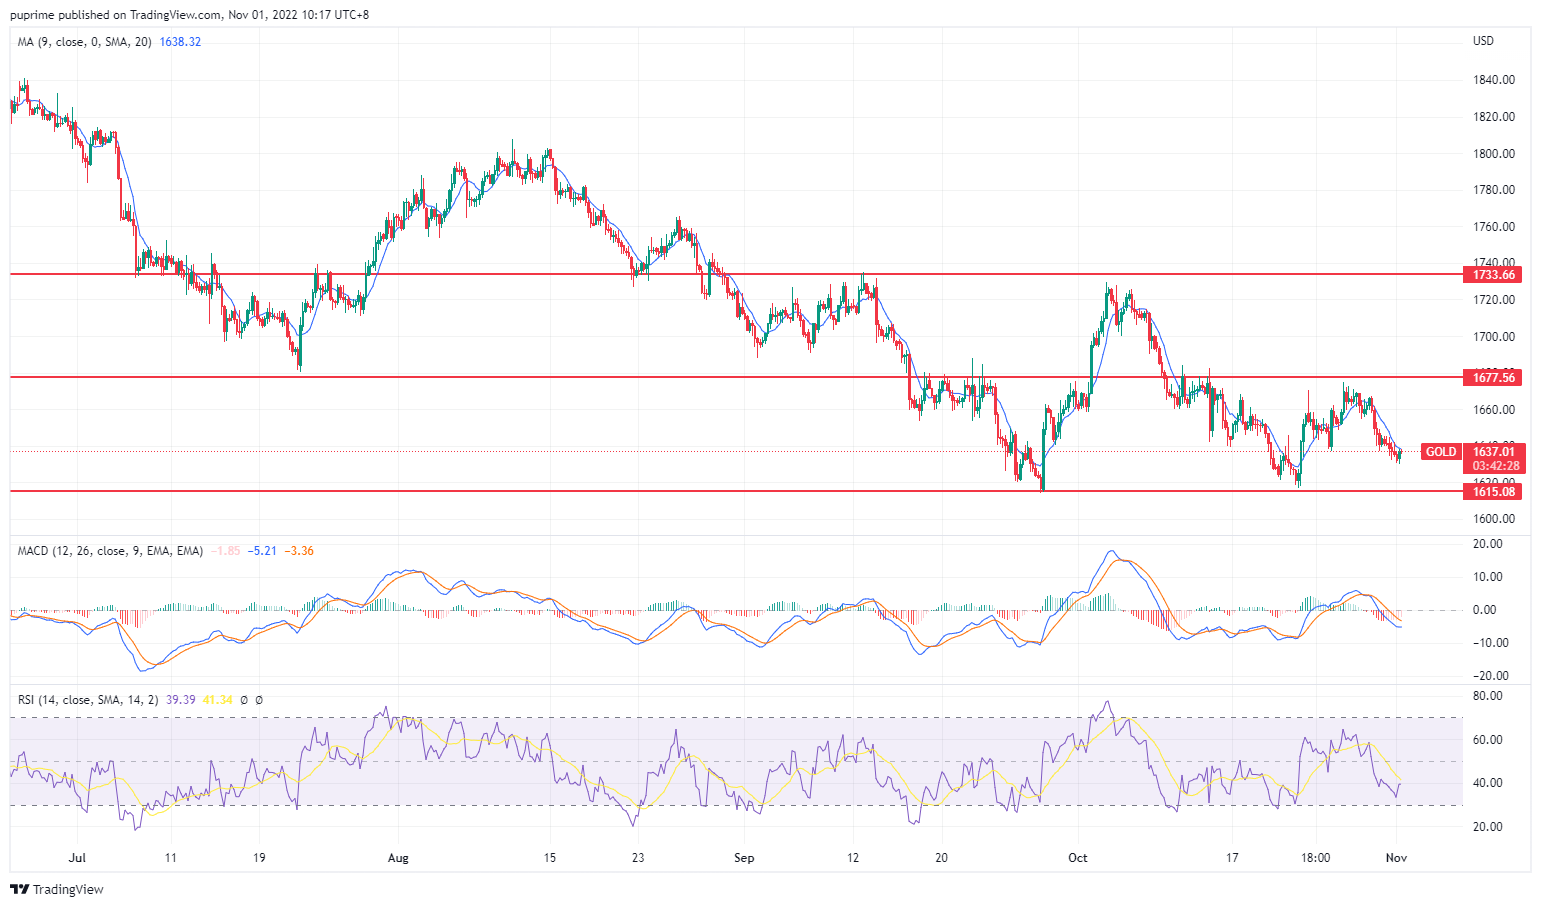
Gold prices fell on Monday due to the recent rebound in US Treasury yields. At the same time, the pressure on gold continued as the Fed is expected to announce an outsized rate hike. Higher interest rates tend to dent the appeal of the non-interest-yielding bullion.
From a technical view, the gold price might continue its bearish momentum as MACD drops below zero line. While RSI is trading around 40 at the time of writing, it indicates that a neutral-to-bearish momentum is ongoing.
Resistance level : 1677,1733
Support level : 1615

EUR/USD
After Euro-zone inflation soared to a fresh all-time high, the Euro retreated from a higher level, reinforcing fears that stagflation is now all but unavoidable. Several European Central Bank (ECB) officials are showing concern about the economic downturn while warning that pushing rates too high too quickly would likely weigh on the economic momentum. A less hawkish tone from the European Central Bank (ECB) had also sparked further selloffs on the Euro.
On the technical front, the Euro was trading lower while currently testing the support level at 0.9875. Nevertheless, MACD had signalled a weakening bearish momentum. At the same time, the RSI at 68 has sharply rebounded from the oversold territory, suggesting that the pair would likely trade higher in the short-term as a technical correction.
Resistance level: 1.0075, 1.0190
Support level: 0.9875, 0.9760
BTC/USD
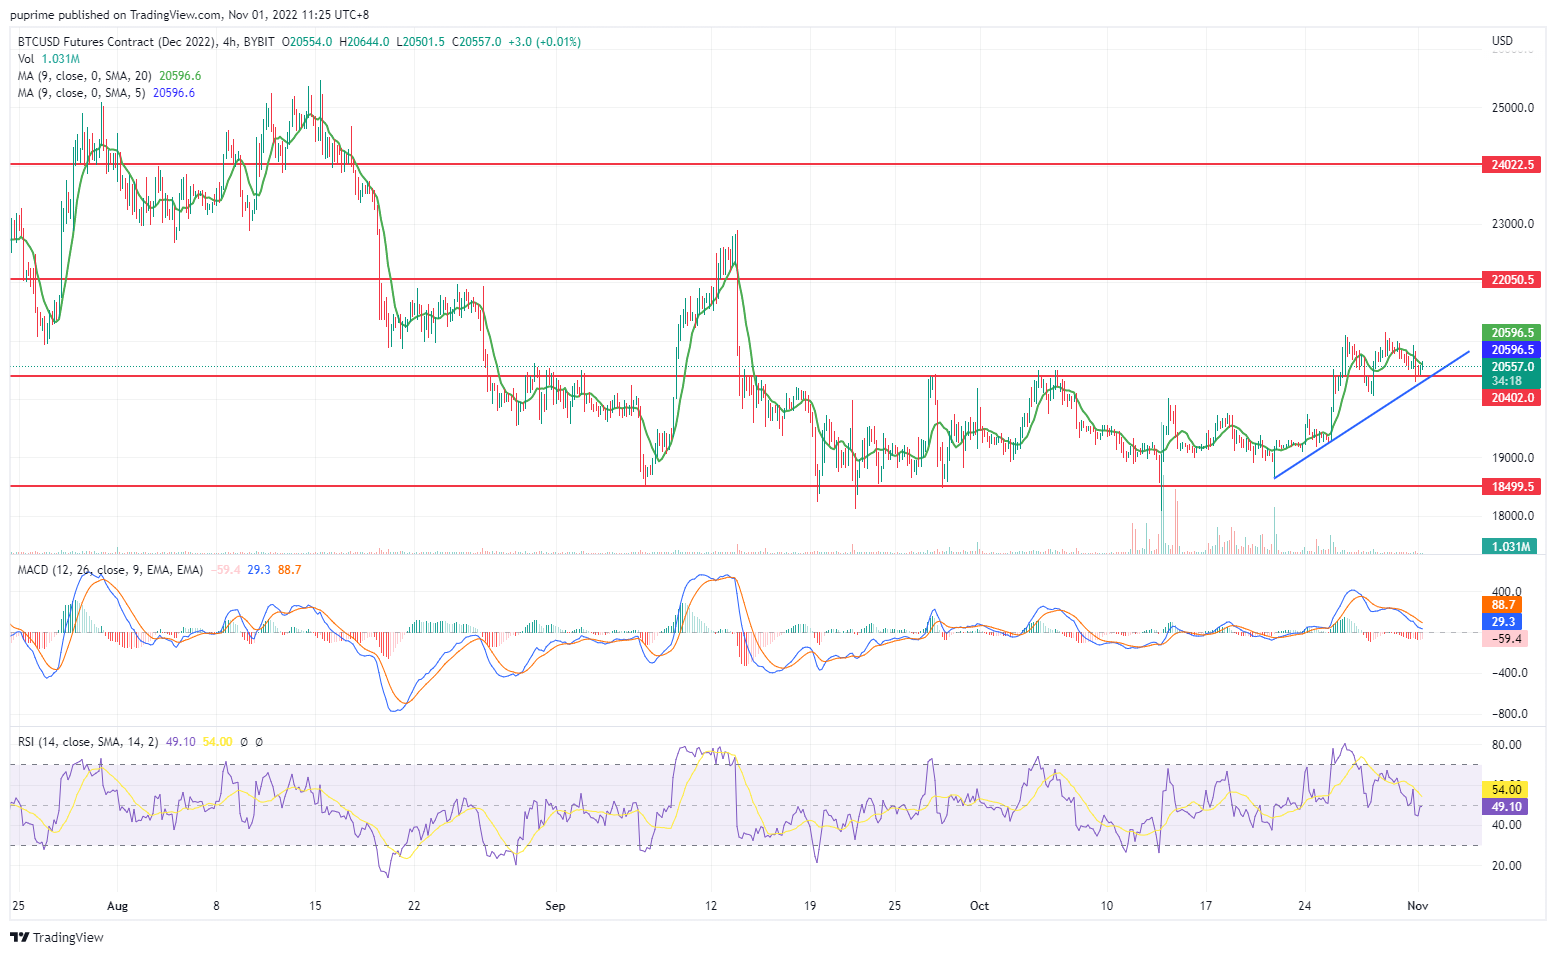
Since the actual rate has an inverse relationship with the BTC, a tightening monetary policy would put high pressure on the coin. The Fed is believed to raise 75 bps for interest rate, resulting in a stronger USD which will be a headwind for BTC.
BTC is struggling to stay above the support at 20400, and the coin’s movement has been minimal over the past few trading days. The MACD is now close to the zero line depicting a bullish momentum for the BTC that might be over. The RSI has fallen below 50, which signals that the seller for BTC is more than the buyer.
Resistance level: 23000, 25000
Support level: 20400, 18500

DJ30
The Dow Jones failed to preserve its upside traction, pressured by the disappointing quarterly results from big technology companies from the United States. Notwithstanding that, it notched up into its strongest monthly bullish momentum in decades as investors speculated that the Federal Reserve would likely moderate its aggressive contractionary monetary policy decision following the recent underwhelming economic data release. The US Treasury yield steadied the following fall last week as investors are now focused on the FOMC meeting to gauge the possible range of movement for the US stock index.
On the technical front, the DJ30 extended its gains while currently testing the resistance level at 33065. However, MACD, which illustrated diminishing bullish momentum, while RSI is at 75, indicating the index was going into overbought territory.
Resistance level: 33065, 34320
Support level: 31045, 29805
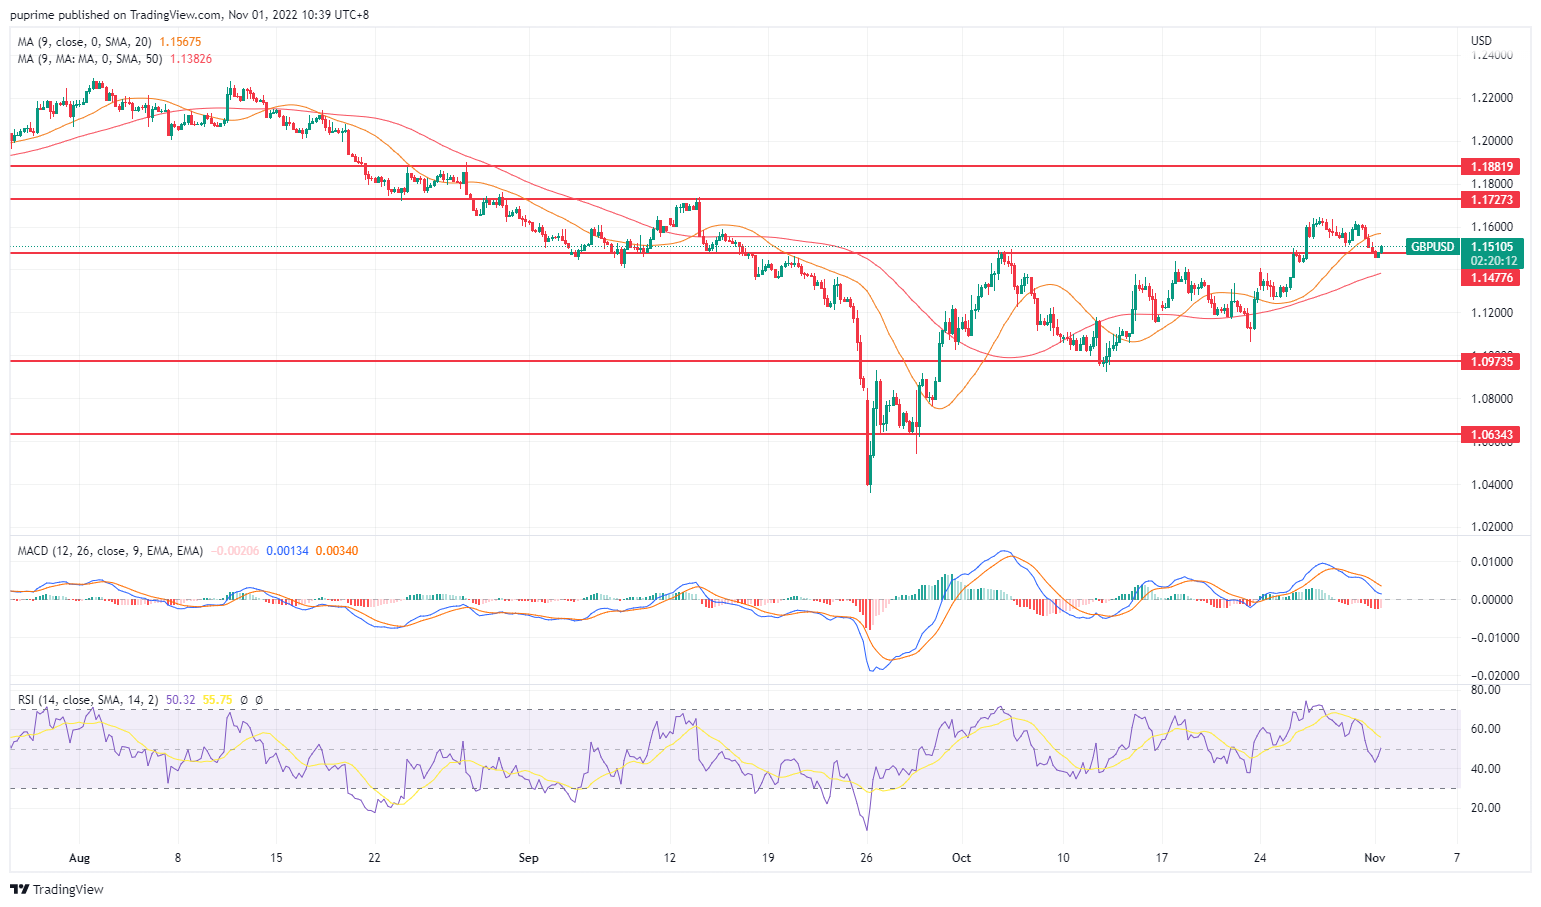
GBP/USD
The pound has benefited from political stability over the past week, but its recovery could lose momentum this week. However, there is some uncertainty about the implications for the upcoming interest rate decisions from the Fed and BoE.
From the technical viewpoint, MACD is turning downward near the zero line, which suggests a diminishing bullish momentum is ongoing. As the RSI is trading around 50, it indicates that investors could keep an eye on it as both directions are possible.
Resistance: 1.1727, 1.1881
Support: 1.1477, 1.0973
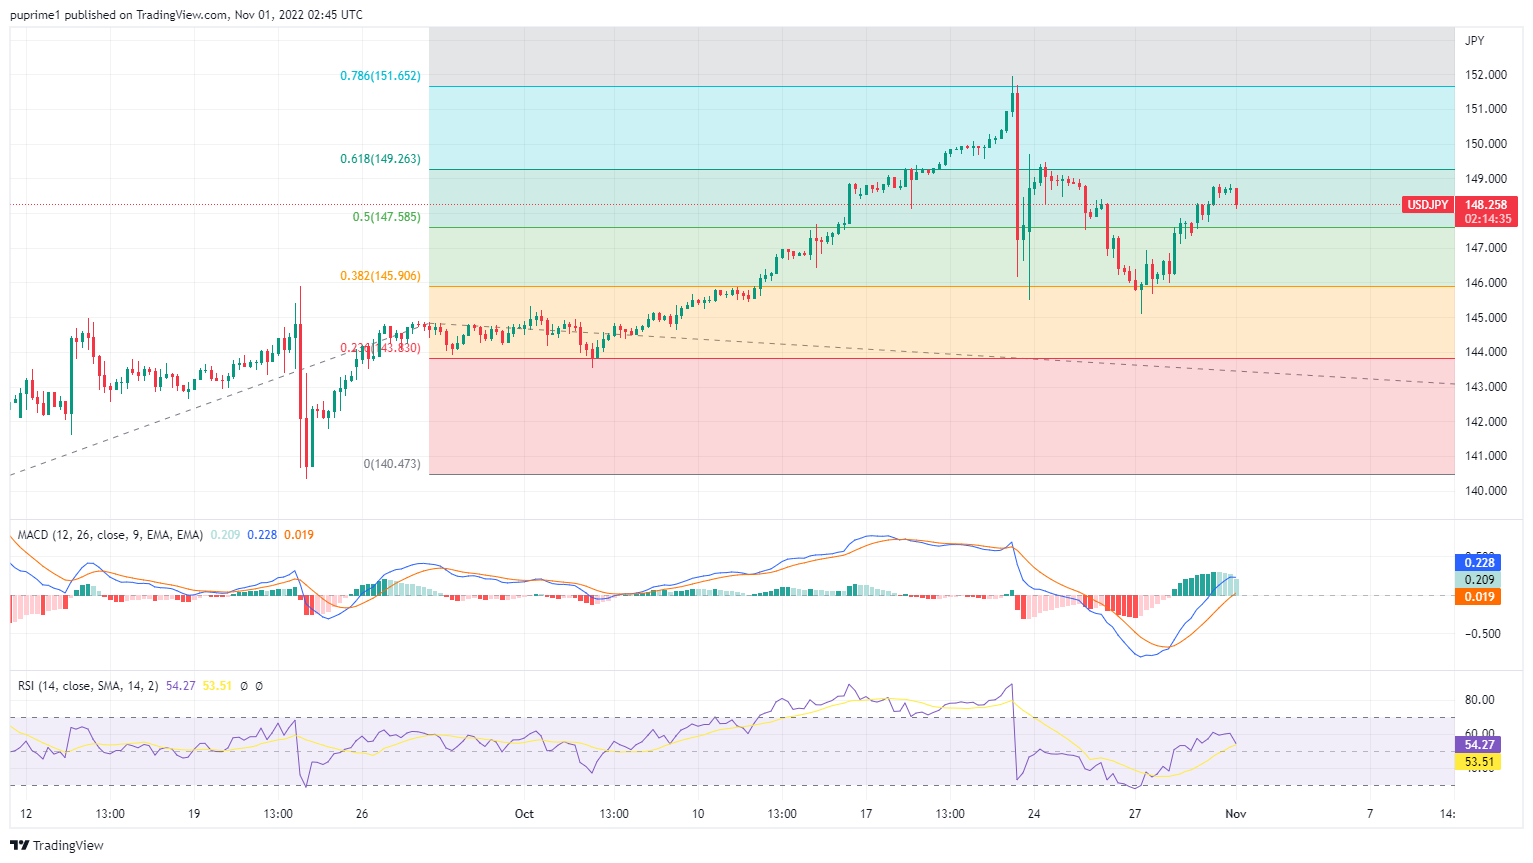
USD/JPY
The overall momentum for the Japanese Yen remained bearish against the US Dollar, with economists expecting the Fed to hike interest rates, widening the policy divergence with the Bank of Japan (BoJ). As for now, investors continue to focus on the FOMC meeting to gauge the likelihood of movement for the Japanese Yen.
From a technical perspective, the pair was trading higher following the prior breakout above the previous resistance level. Nonetheless, MACD illustrated diminishing bullish momentum, while RSI is at 54, suggesting the pair’s outlook remained bearish in the near term as the RSI retreated sharply from overbought levels.
Resistance level: 149.25, 151.65
Support level: 147.60, 145.90

Crude oil
Oil production in the U.S. hit its highest since the COVID-19 pandemic at nearly 12 million barrels per day. Biden’s administration has also called on U.S. oil and gas companies to work on lowering the gas prices. Demand from China, the world’s largest crude importer, fell unexpectedly in October and a widening Covid-Zero policy is believed to affect the demand for crude oil as well.
Crude oil prices are trading within a relatively small price range amid the world’s uncertain economic outlook, hovering near its support line at 85.6. The MACD line has now dropped to near the zero line, suggesting bullish momentum is diminishing and the RSI is merely over 50, indicating that the buying power is not strong.
Resistance level: 90, 94
Support level: 85.6, 82
Articles
Contact Us
For general customer related enquiries
+248 4671 948
[email protected]
For legal or regulatory related enquiries