Wall Street Loses after Failing Earnings Report Released
28 October 2022, 07:35

What You Need to Know
Asian markets dropped alongside the U.S. market as U.S. economic data and major companies’ earnings reports were rather disappointing. The BoJ will announce its policy decision today (28th Oct) and the markets expect the authorities will stick to its rock-bottom rates. Meanwhile, the ECB has raised the policy rate by 75 bps as expected, signalling a greater tightening policy ahead. The tightening petroleum product market and improving U.S. exports have increased the oil price over the week.
| Look Out For |
Over $200 billion evaporated last night as major companies released rather disappointing earnings reports. AAPL dropped 3% as its quarter four earnings did not meet market expectations. At the same time, Amazon slumped near 17% in extended trade, the worst level in over two years. Meta, plunged 25% last night; Alphabet and Microsoft have also dropped about 1 % each.
| Market Overview |

| Economic Calendar |
|---|

DXY
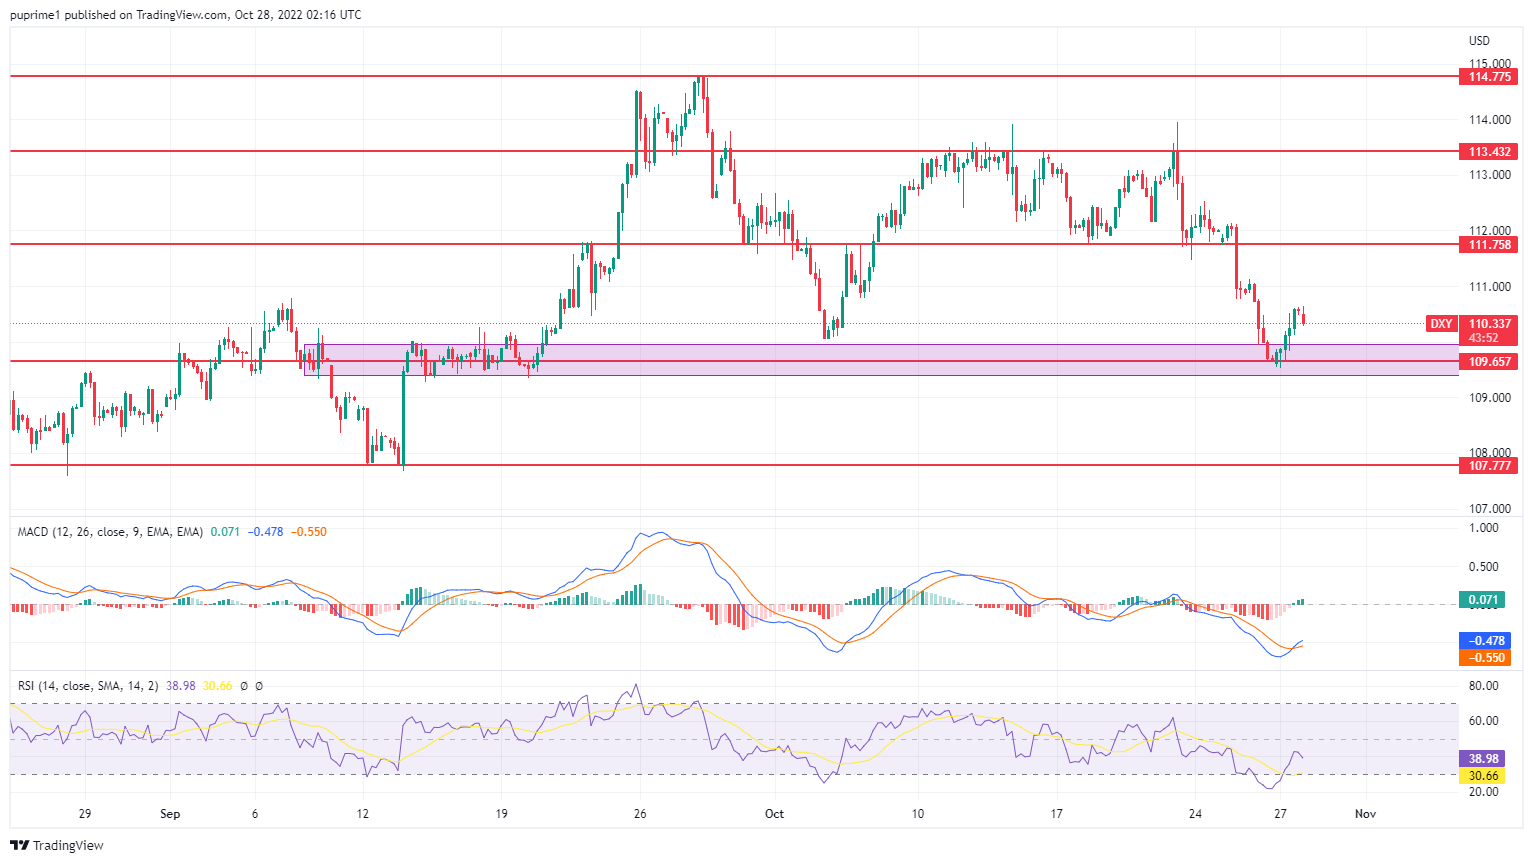
The Dollar Index rebounded significantly from the support level over the backdrop of overwhelming economic data from the United States region yesterday. According to the Bureau of Economic Analysis, US Gross Domestic Product (GDP) for the third quarter unexpectedly improved from the previous reading of -0.6% to 2.6%, exceeding the market forecast of 2.4%. Meanwhile, the Department of Labour reported that the US Initial Jobless Claims came in at 217K, which also fared better-than-market expectation of 220K.
On the technical front, the Dollar Index was traded higher following prior rebounded from the support level. MACD, which illustrated bullish bias while RSI at 34, rebounded sharply from the oversold territory, suggesting the index would likely rebound as a technical correction.
Resistance level: 111.75, 113.45
Support level: 109.65, 107.80

XAU/USD
Gold prices dropped as U.S. GDP data was better than expected. It showed a growth rate of 2.6% on the third quarter GDP data, which was more than the market expectation of 2.4%. Meanwhile, the pair is attempting to establish above $1660 at the time of writing. The market is eyeing on the PCE and Fed rates hikes.
From a technical view, the MACD line made a crossover indicating that a bearish momentum might happen. At the same time, the RSI is hovering within the 50-60 range near the overbought zone.
Resistance level : 1681, 1728
Support level : 1640, 1614
EUR/USD
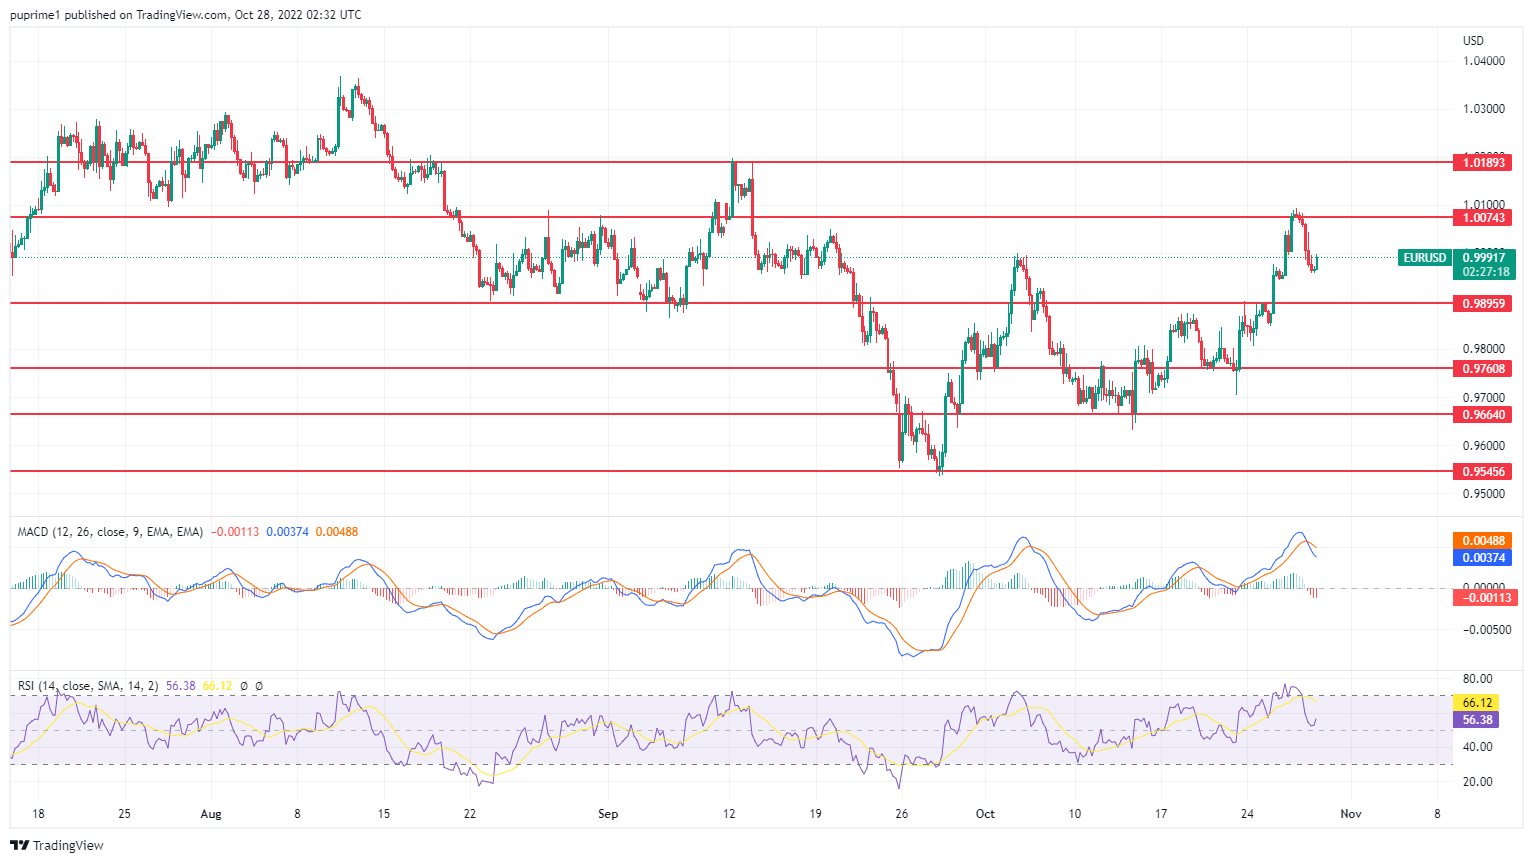
The recent upbeat economic data from the United States region has insinuated a significant selloff on other regional currencies, such as EUR/USD, on a relative basis despite the recent hawkish move from European Central Bank (ECB). Yesterday, the European Central Bank (ECB) raised its deposit rate by 75 basis points to 1.5%, the highest interest rate hike since 2009, to alleviate the future spiking inflation risk.
From a technical viewpoint, the Euro was traded lower following prior retracement from the resistance level at 1.0075. MACD illustrated bearish bias while RSI was at 56 following the sharp retracement from the overbought territory, which indicated the pair would likely extend its losses to the support level.
Resistance level: 1.0075, 1.0190
Support level: 0.9895, 0.9760

BTC/USD
BTC broke through its month-long resistance following a better performance of U.S. equities and a weaker dollar. However, the bullish momentum did not last long as the btc last night fell back below the resistance-turned-support line at 20400.
On the technical side, BTC seems to trade in a false-breakout pattern where it broke the resistance line and quickly reversed on the next trading day. The MACD line has crossed from the above and RSI is falling near 0.
Resistance level: 22900, 24850
Support level: 20400, 18460

DJ30
Dow Jones gained 194.17 points or 0.6% on better-than-expectation GDP data and hinted at waning inflation. It encouraged investors to buy more stocks as bond yields also pulled back after the data release.
DJ30 has been up continuously for 5 days. On the technical front, the RSI has reached the overbought zone at 71.1 when writing, suggesting that a bearish momentum might happen. In contrast, the MACD line is still moving upwards and retains its bullish momentum.
Resistance level: 33244, 35381
Support level: 30557, 28704

GBP/USD
The bullish momentum of the Pound Sterling finally paused after the release of upbeat economic data from the US region. This prompted investors to shift their portfolio into US Dollar while betting against a more aggressive rate hike from the Fed. As for now, investors would continue to scrutinise the future policy from the new UK Prime Minister Rishi Sunak to gauge the likelihood movement for the Pound.
From a technical perspective, the Pound Sterling was currently trading within a range while testing the nearby resistance level at 1.1675. MACD which illustrated increasing bearish momentum, while RSI is at 64 following the sharp retracement from the overbought area, indicating the pair to extend its losses toward the support level.
Resistance level: 1.1675, 1.2000
Support level: 1.1400, 1.1000

USD/JPY
The recent currency intervention policy from the Bank of Japan (BoJ) continued to spark market confidence toward the Japanese Yen, which weighed down the pair of USD/JPY. Nonetheless, the Bank of Japan (BoJ) maintained its ultra-low quantitative easing program on Friday in order to boost up the economic momentum in the Japanese region, limiting the gains experienced by the Yen.
From a technical perspective, the pair of USD/JPY was trading lower while currently nearby the support level of 145.90. Nonetheless, MACD, which illustrated diminishing bearish momentum while RSI is at 42 following the sharp rebound from the oversold territory, indicating the pair would extend its gains toward the resistance level.
Resistance level: 147.60, 149.25
Support level: 145.90, 143.85
Crude oil
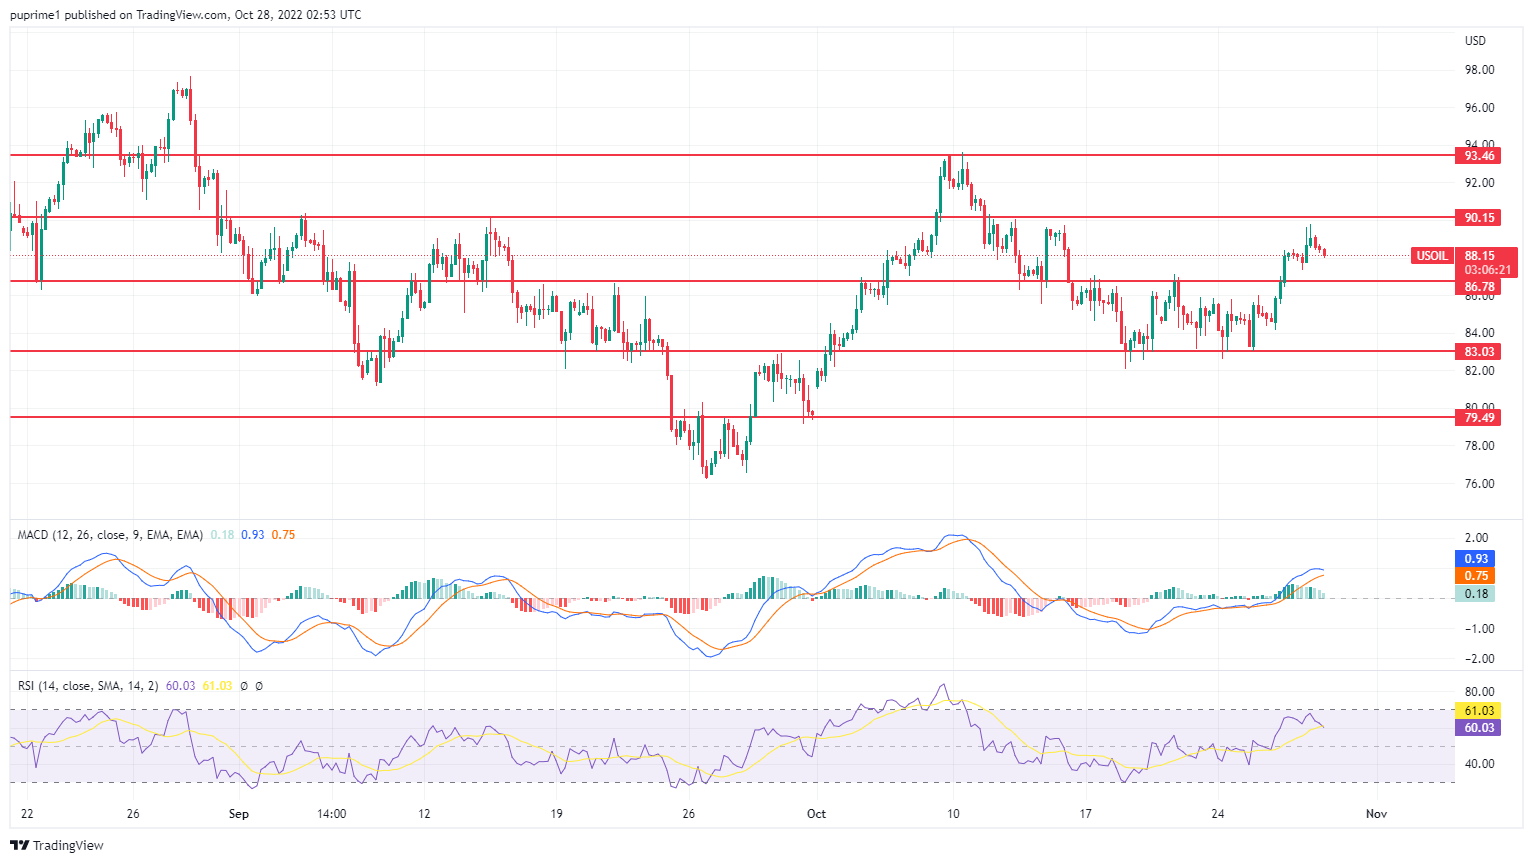
Crude oil prices fell in the early Asian trading market on Friday, supported by a stronger US Dollar. Nonetheless, market participants remained concerned over the aggressive sanction on the crude oil from the European Union to Russia. According to Reuters, the European sanctions on Russian crude oil products are set to take effect in December, sparked further fears about the supply disruption on this black commodity.
Crude was traded lower following prior retracement from the resistance level on the technical front. MACD, which illustrated diminishing bullish momentum while RSI is at 59 following the aggressive retracement from the overbought territory, indicating that the commodity would likely to extend its losses.
Resistance level: 90.15, 93.45
Support level: 86.80, 83.05
Articles
Contact Us
For general customer related enquiries
+248 4671 948
[email protected]
For legal or regulatory related enquiries