Xi Jinping Clinched His Third Presidency Term
24 October 2022, 06:38

| What You Need to Know |
The long-delayed China economic data showed that the nation’s economy grew faster than expected. At the same time, President Xi secured his 3rd term as the country’s premier and vowed to deepen economic ties with other countries. On the other side, the Yen rallied more than 1% against the dollar amid a 2nd intervention from Japan’s authorities. Across the ocean, Australian bond yields rise to record high as market bets for accelerating inflation in the country.
| Look Out For |
Current rate hike bets on 2nd November Fed interest rate decision:
75 bps (95.3%) VS 50 bps (4.7%)
| Market Overview |

| Economic Calendar |
|---|

Market Movements
XAU/USD
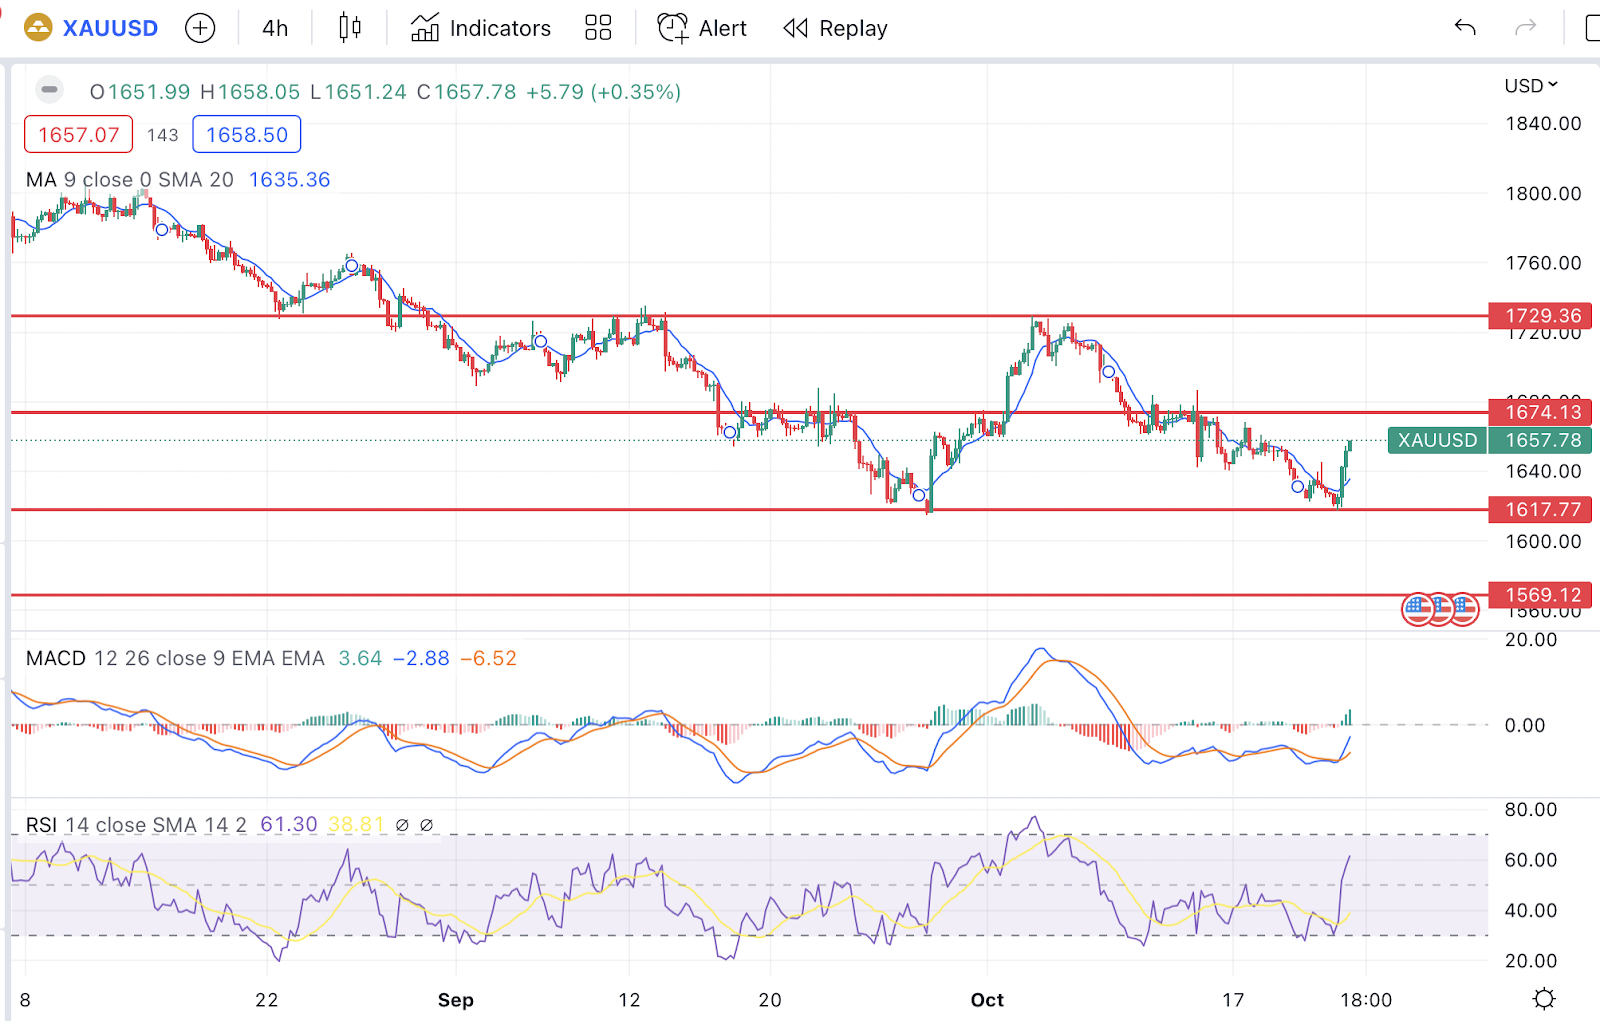
Gold prices rebounded on the soft US Dollar following the member of the Federal Reserve signalled a less aggressive rate hike decision in future. Besides that, the rising tensions between Russia-Ukraine recently had also stoked a shift in sentiment toward the safe-haven gold, which spurred further bullish momentum on the commodity.
Gold traded higher on the technical front while currently testing the resistance level at 1674.15. The MACD, which illustrated increasing bullish momentum, suggests the commodity extended its gains after successfully breaking out above the resistance level.
Resistance level: 1674, 1729
Support level: 1617, 1569
BTC/USD
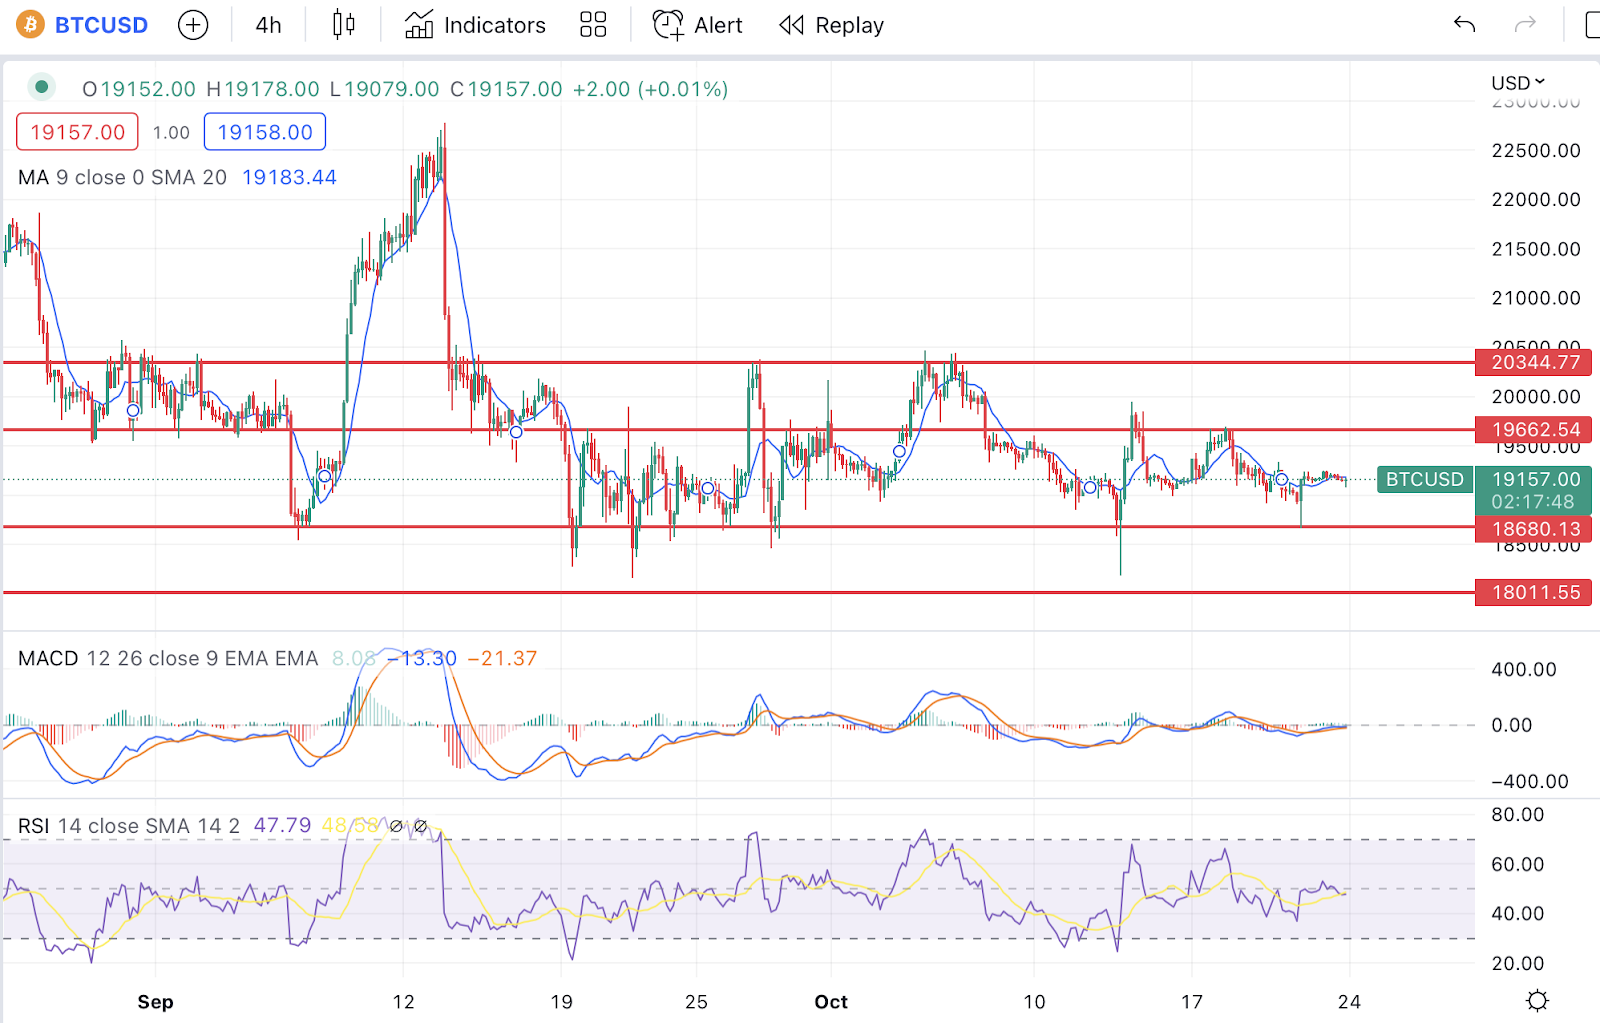
BTC continues to trade within a sideways pattern between 19662.55 and 18680.15 amid a lack of catalyst from the cryptocurrency market.
On the technical front, investors should highly focus on the resistance level at 19662.55 and the support level at 18680.15. The MACD has been hovering around the zero line, same with the RSI ranging near 50, with both depicting a lack of direction for the BTC.
Resistance level: 19662, 20344
Support level: 18680, 18011

EUR/USD
Due to the lack of market catalysts from the European region, the overall bullish for the pair of EUR/USD was primarily due to the weakening US Dollar. Recently, the US Treasury yields’ bullish momentum finally hit a pause after the Federal Reserve signalled a less aggressive interest rate hike after November.
The EUR/USD pair was hovering near the upper trend line on the technical front. MACD, which illustrated increasing bullish momentum, suggested the pair extended its gains toward the resistance level at 0.9970 after successfully breaking the trend line.
Resistance level: 0.9970, 1.0160
Support level: 0.9685, 0.9540
DJ30
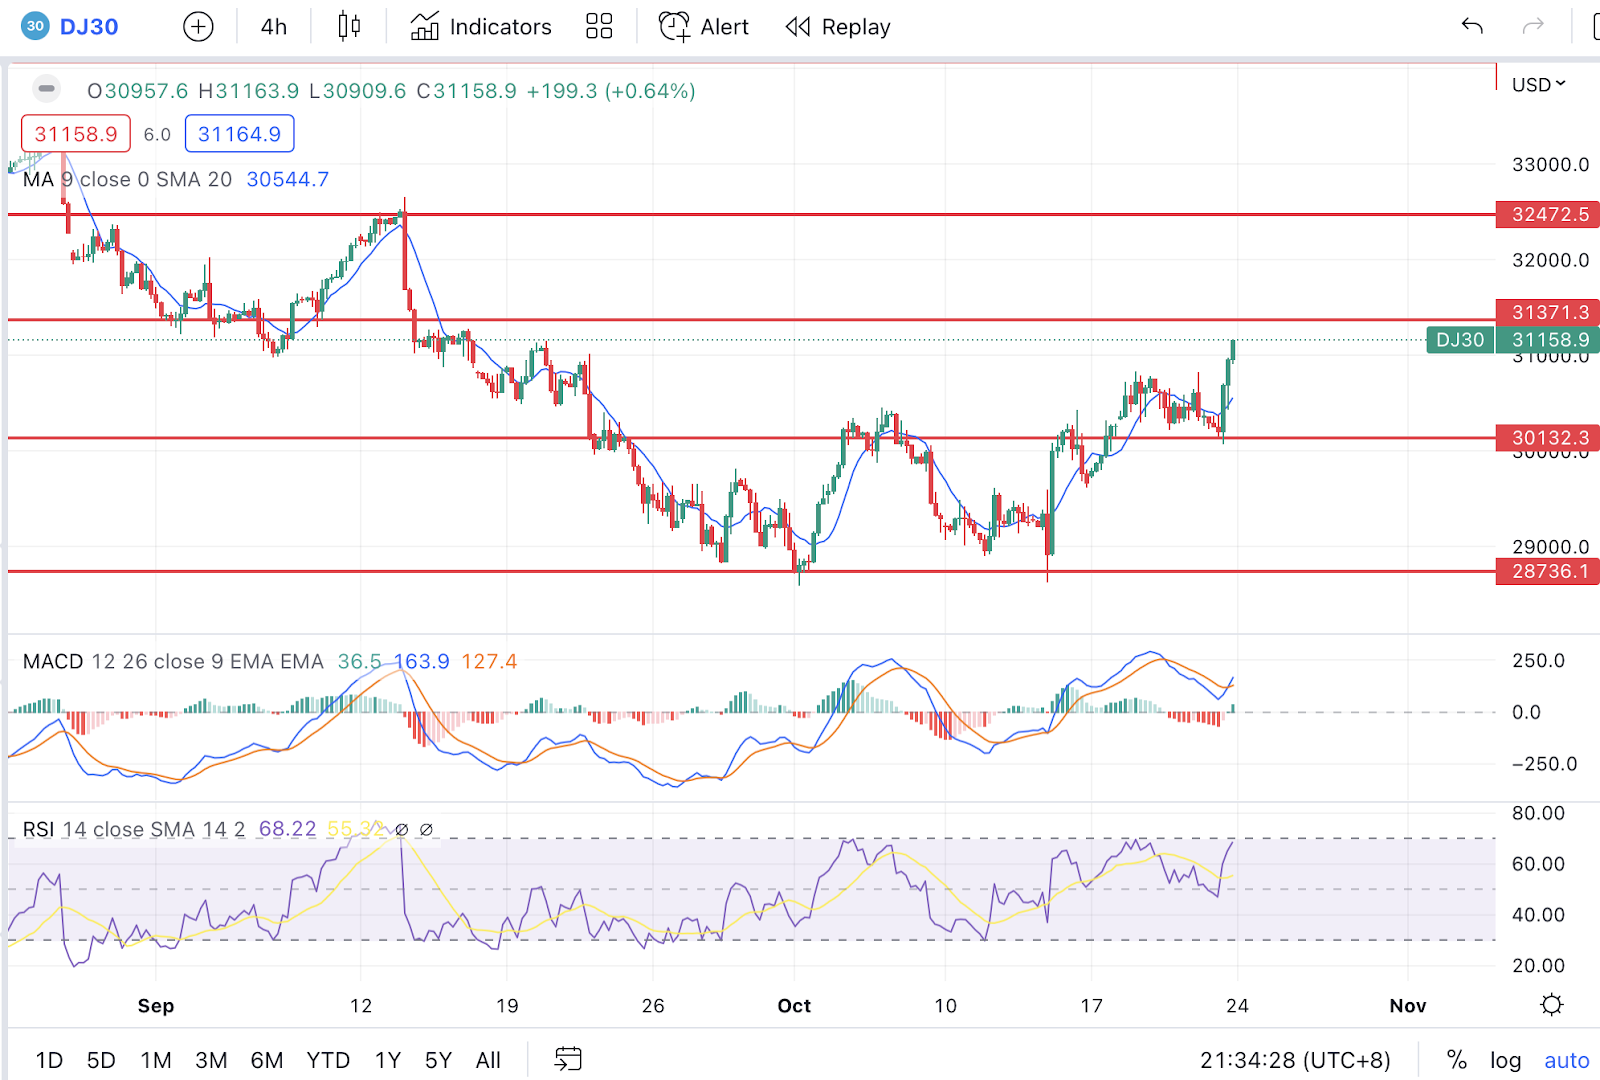
DJ rebounded significantly amid the drop in the US Treasury yield following the member of the Federal Reserve signalling a less aggressive rate hike decision in future. According to Reuters, San Francisco Federal Reserve Mary Daly claimed that the Federal Reserve should avoid putting the economy into an “unforce recession” by raising the interest rates too sharply. It is time the consideration slowed down the pace of its interest rate hikes.
On the technical front, the DJ30 rebounded from the strong support level at 30132. MACD, which illustrated increasing bullish momentum, suggested the index extend its gains toward the resistance level at 31371
Resistance level: 31370, 32472
Support level: 30132, 28736

GBP/USD
The Pound Sterling rebounded significantly from the crucial support level at 1.1480 amid the recent depreciation of the US Dollar. Nonetheless, the long-term trend for the Pound Sterling remained uncertain amid the current political turmoil that had added further tensions for the economy following the resignation of UK Prime Minister Liz Truss. The following week, the leadership election will be announced to replace Liz Truss. At the same time, Rishi Sunak and Penny Mordaunt are the front-runners for the next nation’s Prime Minister, and high hopes were placed on these two candidates to stabilise the UK economy headwind.
On the technical front, the pair of GBP/USD is currently forming a head and shoulder signal. Nonetheless, MACD, which illustrated diminishing bearish momentum, suggests the pair be traded higher in the short-term as a technical correction.
Resistance level: 1.1480, 1.1725
Support level: 1.0975, 1.0635

USD/JPY
The Japanese Yen surged significantly against the US Dollar, the most significant daily appreciation for the Japanese Yen in more than two months as the speculation of currency intervention from the Bank of Japan (BoJ) to stem a slide in their battered currency. Earlier, the Yen dipped into a 32-year low this year as traders focused on the widening yield gap between the US and Japan, insinuating the further need for currency intervention from the Bank of Japan (BoJ).
On the technical front, the pair of USD/JPY retraced from the crucial resistance level at 151.45 amid the expectation of currency intervention from the Bank of Japan (BoJ). With the combination of the recent weakness from the US Dollar, the investor could predict the pair of USD/JPY would extend its gains toward the support level at 145.05.
Resistance level: 151.45, 164.70
Support level: 145.05, 140.60

Crude oil
The overall trend for crude oil remained bearish as the market participants’ fears over the high inflationary pressures around the world would continue to weigh on the oil market outlook. Though, the losses experienced by the crude oil were limited following China’s plans to ease the Covid-19 quarantine periods for visitors from 10 days to 7 days.
On the technical front, crude oil was still trading within a range while testing the support level at 84.30 recently due to the mixed market sentiment for this black commodity. MACD, which illustrated the golden-cross signal, suggested the commodity rebound from the support level at 83.30 toward the first resistance level at 93.55.
Resistance level: 93.55, 103.90
Support level: 84.30, 76.20

US Dollar Index
The Dollar Index, which traded against a basket of six major currencies, retraced from the resistance level following the Federal Reserve’s dovish tone on its future monetary policy while reiterating that the Fed might consider a less aggressive rate hike decision after November. According to Reuters, San Francisco Federal Reserve Mary Daly claimed that the Federal Reserve should avoid putting the economy into an “unforce recession” by raising the interest rates too sharply. It is time the consideration slowed down the pace of its interest rate hikes. Expectations upon the slower pace of the rate hike decision helped to cool the surge in US treasury yield, dragging down the US dollar appeal.
On the technical front, the Dollar index was traded lower while currently testing the support level at 111.55. MACD illustrated an increasing bearish momentum suggesting the index extended its losses after breakout the support level.
Resistance level: 113,23, 114.70
Support level: 111.55, 109.95
Articles
Contact Us
For general customer related enquiries
+248 4671 948
[email protected]
For legal or regulatory related enquiries