Yen goes Strong as Markets Expect BoJ Intervention
27 October 2022, 08:03

What You Need to Know
It is almost certain that the ECB will raise interest rates by 75 bps on Thursday European time for its tightening policy to curb inflation. Oil prices rose for the 3rd consecutive day as U.S. domestic fuel inventories hit a historic seasonal low, depicting a tightening supply outlook.
On the other side of the world, the yen has rallied some 4% over the past 3 days after it hit 30-year-low against the USD last week as the market is expecting the BoJ to step in to support the Yen.
| Look Out For |
Current rate hike bets on 2nd November Fed interest rate decision:
75 bps (89.3%) VS 50 bps (10.7%)
| Market Overview |

| Economic Calendar |
|---|

Market Movements

DXY
The Dollar Index continues to experience significant selling pressure as market participants remain cautious ahead of FOMC meeting minutes. Meanwhile, the US 10-year Treasury yield continued to retrace from its multi-year high last week as the Federal Reserve hinted at a less hawkish policy following the release of underwhelming economic data. As for now, investors would continue to scrutinise the FOMC meeting decision to receive further trading signals for the US Dollar.
From a technical perspective, the Dollar Index was traded lower while currently testing the support level at 109.65. Nonetheless, MACD illustrated diminishing bearish momentum while RSI was below 30, indicating the product was going into an oversold area.
Resistance level: 111.75, 113.45
Support level: 109.65, 107.80

XAU/USD
The pair is losing positive momentum in the near term but remains gains around $1663 as the dollar slides. Meanwhile, markets are now waiting for the Q3 Gross Domestic Product report.
From a technical view, MACD breaks through the zero line, indicating bullish momentum. At the same time, RSI is still hovering at 50-60, showing bullish momentum.
Resistance level : 1681,1728
Support level : 1640, 1614
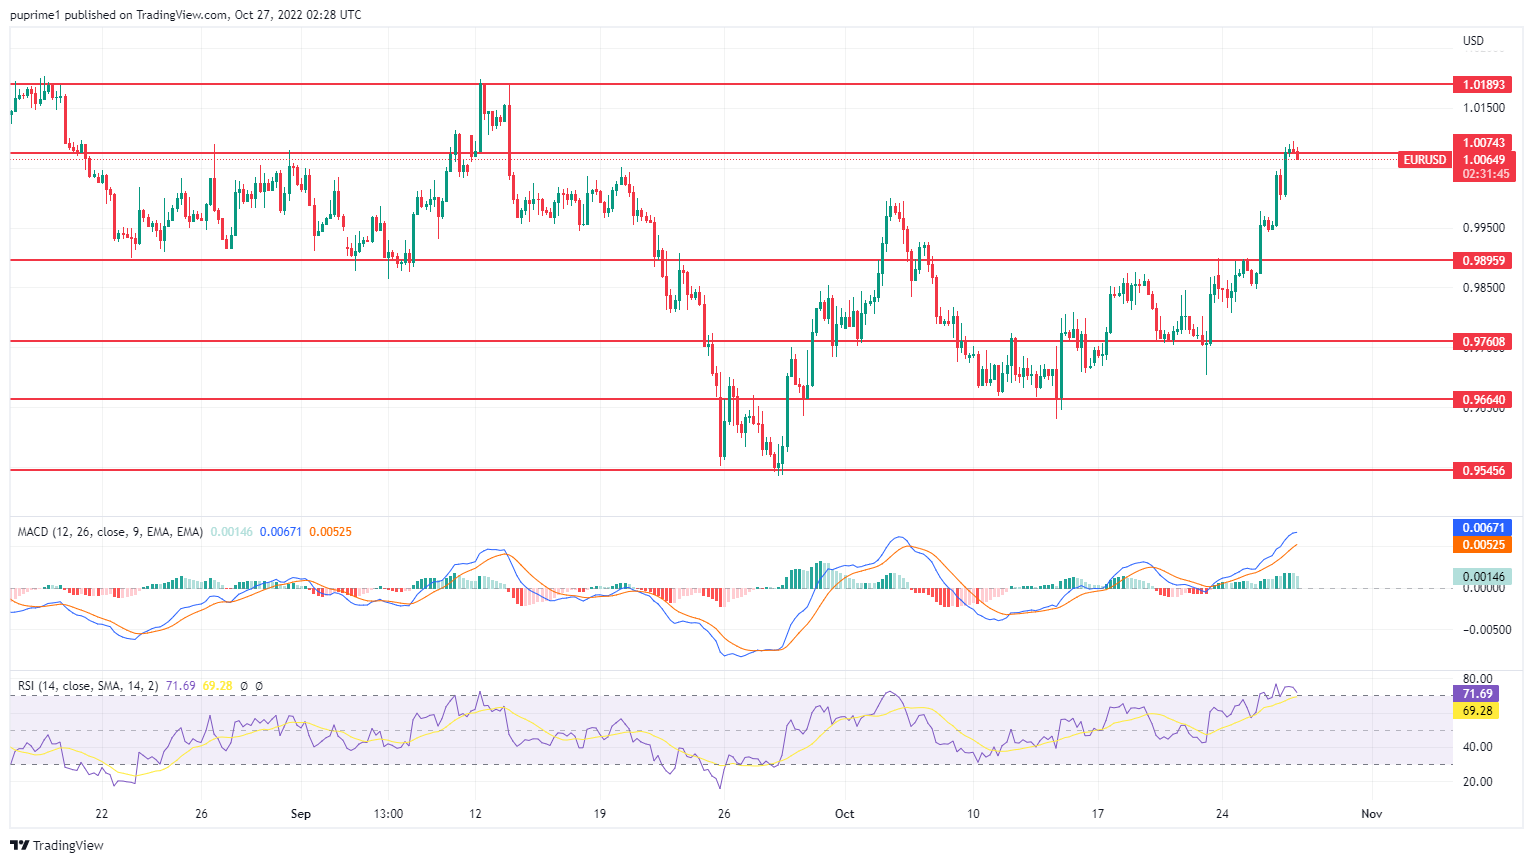
EUR/USD
The significant depreciation of the Greenback has continued to spark bullish momentum on EUR/USD as a relative basis. On the other hand, the Euro extended its gains ahead of the European Central Bank interest decision, which was scheduled at 14:15 (EET) today. Economists forecasted that the European Central Bank (ECB) would likely raise its interest rates again, taking another huge step in tightening policy to stabilise the spiking inflation rate.
On a technical view, the Euro was traded higher while currently testing the resistance level at 1.0075. Nevertheless, MACD had signalled a weakening bullish momentum. While RSI at 68, indicating the product was going into overbought territory, suggested the pair could trade lower in the short-term as profit-taking from investors.
Resistance level: 1.0075, 1.0190
Support level: 0.9895, 0.9760

BTC/USD
BTC rallied by more than 3 % alongside the U.S. equities markets and a weaker usd. The cryptocurrency was consolidating for the past month and it could be the investors who have been accumulating the coin. BTC has also broken through its resistance at 20400 and the resistance has now turned into a support line for the coin.
On the technical side, the MACD line continues to widen the gap with the signal line on the above suggesting that the bullish momentum is still strong. However, the RSI has gone above 70 at 77, suggesting an overbought signal for the coin.
Resistance level: 23130
Support level: 20400, 18475

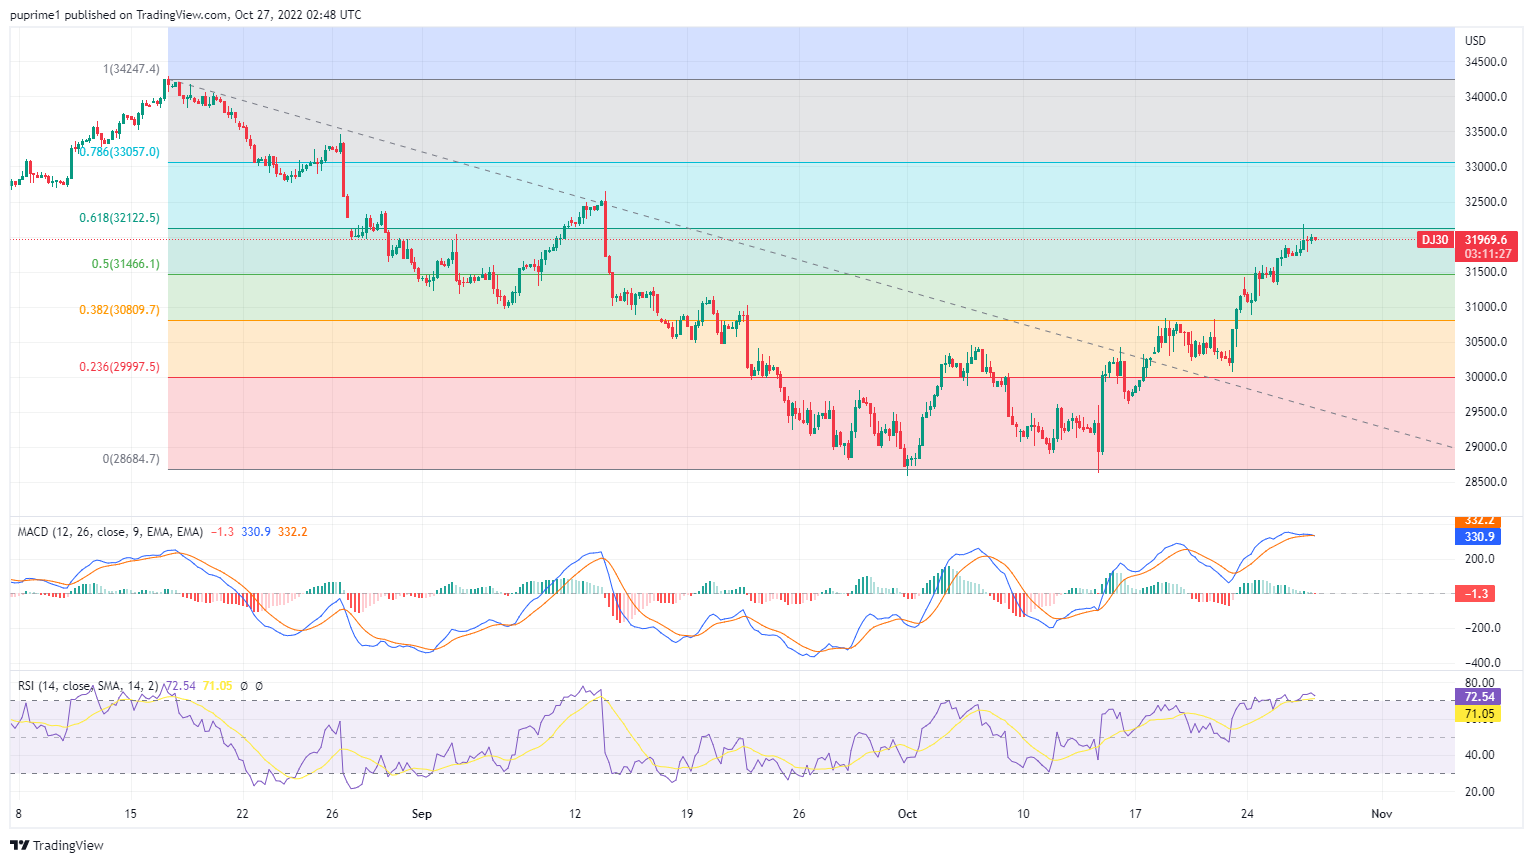
DJ30
The Dow Jones bullish momentum finally paused, as downbeat earnings reports from the major technologies company in the United States sparked growing fears in the US equity market. Microsoft and Alphabet, which dipped by 7.7% and 9.1% following their third-quarter earnings failed to meet Wall Street expectations, respectively.
From a technical view, the DJ30 was traded flat while currently testing the Fibonacci (61.8%) level at 32125. Nevertheless, the MACD and RSI have indicated that the DJ30 is currently at an overbought level, suggesting the index to be traded lower in the short term as a technical correction.
Resistance level: 32125, 33055
Support level: 31465, 30810
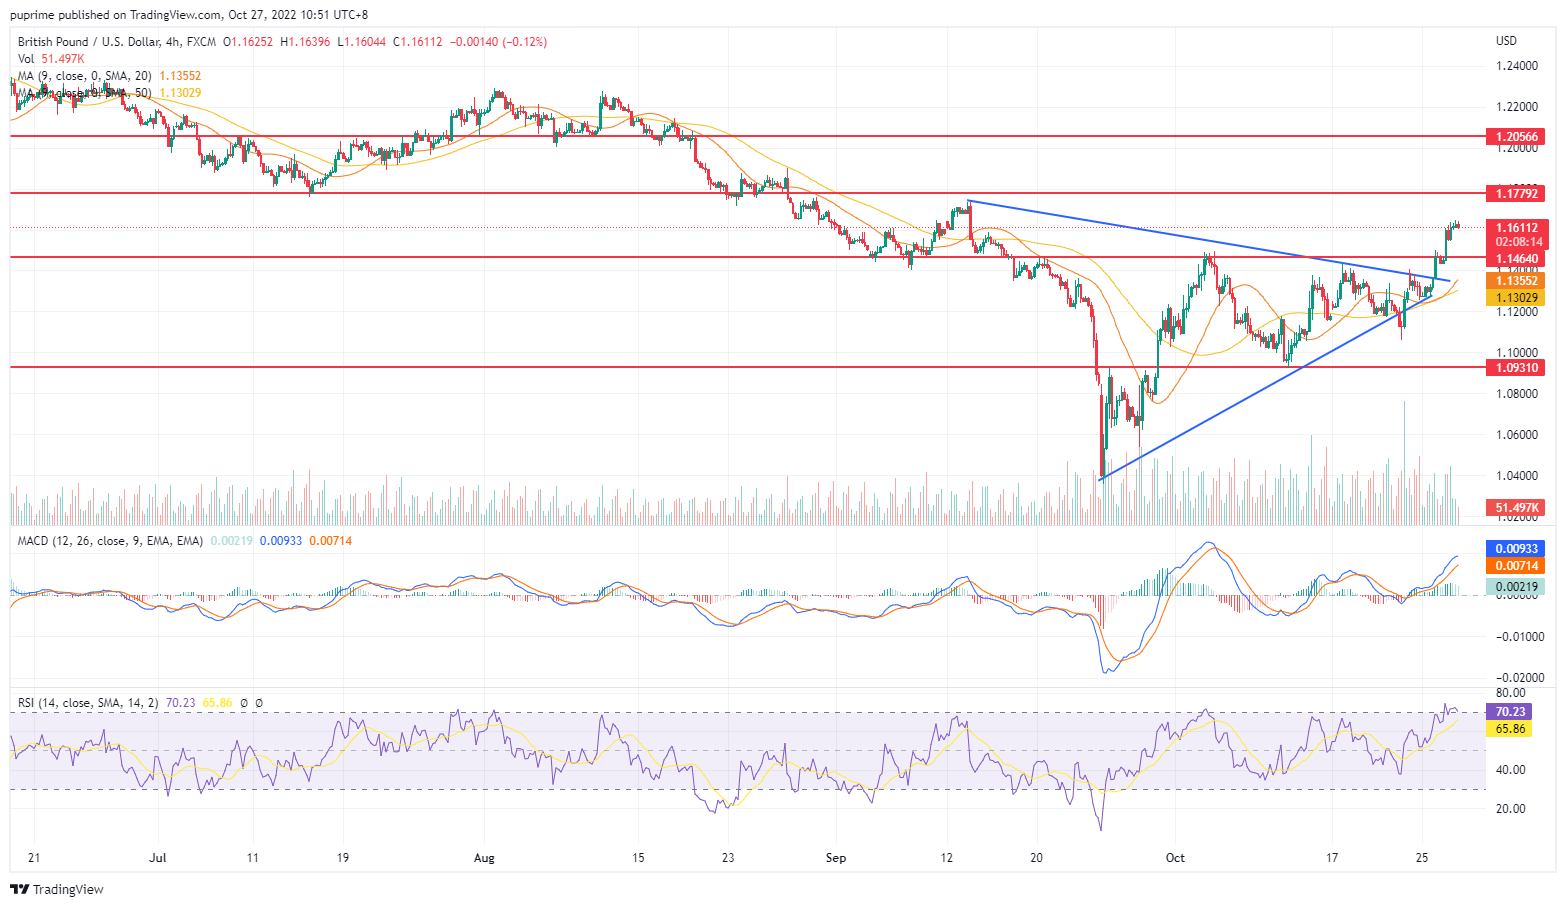
GBP/USD
The pound lifted to a six-week high against the dollar after the chancellor announced that he would delay the economic plan. The pair rose in recent days as markets supported the appointment of Rishi Sunak as prime minister.
From a technical view, the pair is breaking through the ascending triangle chart, indicating an uptrend may be expected to continue. Moreover, MACD is still within the bullish momentum. In contrast, RSI has almost reached its overbought zone at 70, which indicates a bearish momentum might happen soon.
Resistance: 1.1779, 1.2056
Support: 1.1464, 1.0931
USD/JPY
The Japanese Yen recently continued to rise as investors digested positively toward the currency intervention from the Bank of Japan (BoJ). According to official data, Japan may have spent a record 5.5 trillion yen to stabilise the falling yen. On the other hand, the weak US Dollar had also exerted further bearish momentum on the pair of USD/JPY.
From a technical perspective, USD/JPY was testing lower while currently testing the support level at 145.90. Nonetheless, MACD illustrated diminishing bearish momentum while RSI is at 31, suggesting the pair is presently in oversold territory.
Resistance level: 147.60, 149.15
Support level: 145.90, 143.85

Crude oil
Driven by the record-high U.S. crude exports and the weaker USD, the oil price demand is high, and the oil price surged more than 3% last night. Additionally, the U.S. and the E.U. will likely opt for a more loosely policed cap at a higher price.
On the technical side, the oil price is surging with a solid bullish momentum, trading above the support line at 85.5. The MACD line is running above the zero line, and the RSI is yet to touch 70 points suggesting that the bullish trend is still strong.
Resistance level: 90.0, 95.0
Support level: 85.5, 82.4
Articles
Contact Us
For general customer related enquiries
+248 4671 948
[email protected]
For legal or regulatory related enquiries